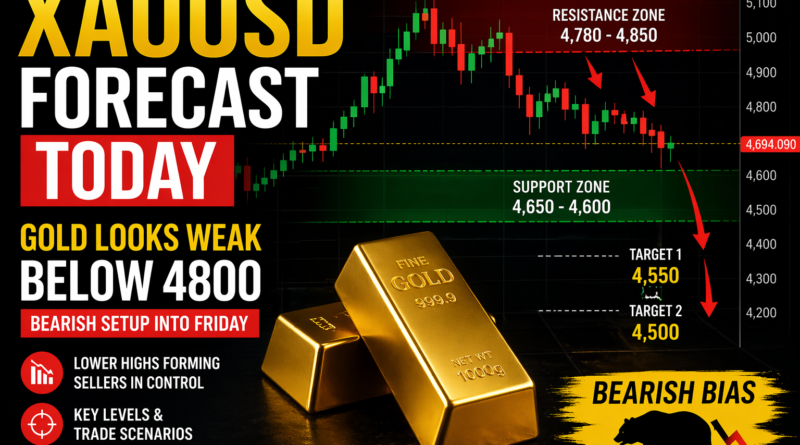
XAUUSD Gold Analysis Guide: Understanding Weak Market Structure Below 4,800 Into Friday
PAIR: XAUUSD (Gold)
Gold (XAUUSD) is often influenced by shifts in market sentiment, US Dollar strength, and global risk conditions. Because of this, price rarely moves in a straight line. Instead, it moves in waves of expansion, consolidation, and correction.
This article explains the current behavior of gold in a simple, educational way. The goal is to help readers understand market structure and key levels without relying on predictions or trade signals.
Market Behavior Overview
Recently, gold experienced a strong recovery after a previous sharp sell-off. However, the follow-through has been weak.
Instead of continuing higher, price has shown:
- Repeated failure to break resistance
- Formation of lower highs
- Slow and uneven movement
This type of structure usually suggests that buyers are losing momentum, while sellers are gradually becoming more active at higher levels.
At the same time, there is no aggressive selling pressure, which means the market is still adjusting rather than trending strongly.
Overall, this is a transition phase, not a clear directional trend.
Current Price Environment
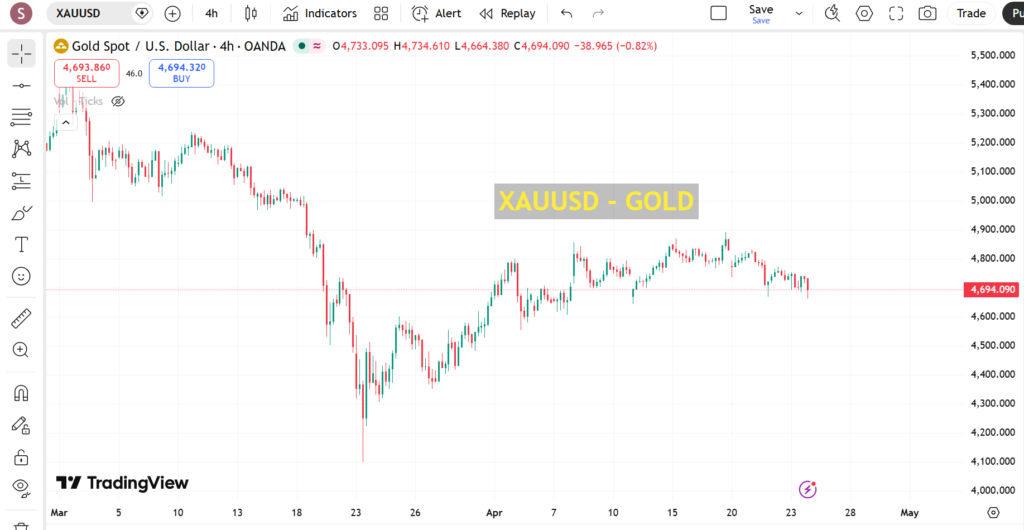
Gold is currently trading around 4,690–4,700, where price action is relatively slow and compressed.
In this kind of environment:
- Momentum is low
- Traders are waiting for confirmation
- Price tends to move in smaller ranges
- False moves can appear in both directions
This is typical after a strong move where the market is deciding whether to continue or reverse.
Key Technical Zones
Instead of treating levels as buy or sell signals, it is more accurate to view them as areas where the market reacts.
Resistance Zone: 4,780 – 4,850
This area has consistently acted as a rejection zone.
Common behavior here includes:
- Price slowing down
- Failed breakout attempts
- Increased selling interest
This suggests that supply is active in this region.
Support Zone: 4,650 – 4,600
This area has previously acted as a strong reaction zone.
Typical behavior includes:
- Temporary price stabilization
- Buying interest appearing
- Short-term rebounds
If this area breaks decisively, it may indicate that sellers are gaining stronger control.
Market Structure Analysis
Market structure helps us understand the broader direction of price.
Current observations:
- Lower highs are forming after the recent bounce
- No strong breakout above resistance
- Momentum is fading on the upside
This reflects a weak or corrective structure, where bullish strength is not fully established.
However, it is important to note that structure only becomes confirmed when price breaks key levels with follow-through.
Why Gold Moves in This Way
Gold is heavily influenced by macroeconomic and liquidity conditions, such as:
- US Dollar strength or weakness
- Interest rate expectations
- Inflation data
- End-of-week positioning
- Global risk sentiment
When these factors are mixed, gold often:
- Moves sideways
- Forms false breakouts
- Reacts strongly at key zones
This creates a challenging environment for short-term traders.
Market Bias (Educational View)
From a structural perspective, the market is showing a slightly weak or bearish-leaning condition below 4,780.
This does not mean price will fall immediately. It simply indicates:
- Upside momentum is weakening
- Resistance zones are being respected
- Buyers need stronger confirmation to regain control
Bias should always be adjusted based on confirmed breakouts or breakdowns.
Invalidation Level
The current structure would shift if:
- Price breaks and holds above 4,850
If this happens:
- Market structure would turn bullish
- Sellers lose short-term control
- Price may move into higher resistance areas
This is why confirmation is more important than assumptions.
Scenario-Based Market Understanding
Instead of predictions, traders often study possible outcomes:
Scenario 1: Resistance Reaction
If price approaches 4,780–4,850 and shows rejection:
- Market may remain range-bound or drift lower
- Indicates continued supply pressure
- Confirms weak bullish momentum
Scenario 2: Support Breakdown
If price breaks below 4,650 with strength:
- Indicates increased downside pressure
- Market may move toward lower liquidity zones
- Sellers likely gain short-term control
Scenario 3: Range Continuation
If neither level breaks:
- Market remains sideways
- Low momentum environment continues
- False breakouts may occur
This is common on Friday trading sessions.
Why Friday Trading Behavior Matters
End-of-week sessions often behave differently because:
- Traders close positions
- Institutions adjust exposure
- Liquidity can become irregular
This can result in:
- Sharp but short-lived moves
- Fake breakouts
- Sudden reversals
Because of this, patience and confirmation become especially important.
Conclusion
Gold (XAUUSD) is currently in a weak and indecisive structure below 4,800, showing limited bullish follow-through after a recent recovery.
Key takeaways:
- Resistance remains strong around 4,780–4,850
- Support is located near 4,650–4,600
- Market is in a transition phase, not a strong trend
- Confirmation is required before any directional confidence
In simple terms, gold is not clearly trending. It is reacting, adjusting, and waiting for a stronger catalyst before choosing direction.
Disclaimer: Trading forex and CFDs involves significant risk and may not be suitable for all investors. This article is for educational purposes only and should not be considered financial advice.
Written by Shah – Forex trader and market analyst at Forex News 360.