
XAU/USD Remains Under Strong Selling Pressure as Bears Control the Market – June 2026
Gold Price Analysis: XAU/USD Remains Under Strong Selling Pressure
Gold (XAU/USD) remains under significant selling pressure after breaking below several important support levels. Based on the latest 4-hour and 15-minute charts, the market structure is clearly bearish, with sellers maintaining control and buyers struggling to create a meaningful recovery.
This article provides an educational market analysis based on current price action. It is not financial advice and should be used for informational purposes only.
Market Overview
At the time of analysis, gold is trading around 4328, following a sharp decline from the 4460–4480 region.
The recent sell-off shows:
- Strong bearish momentum
- Lower highs and lower lows
- Price trading below short-term moving averages
- Weak buying interest during pullbacks
- Increased volatility after the breakdown
The overall trend remains negative unless buyers can reclaim major resistance zones.
What the 4-Hour Chart Shows
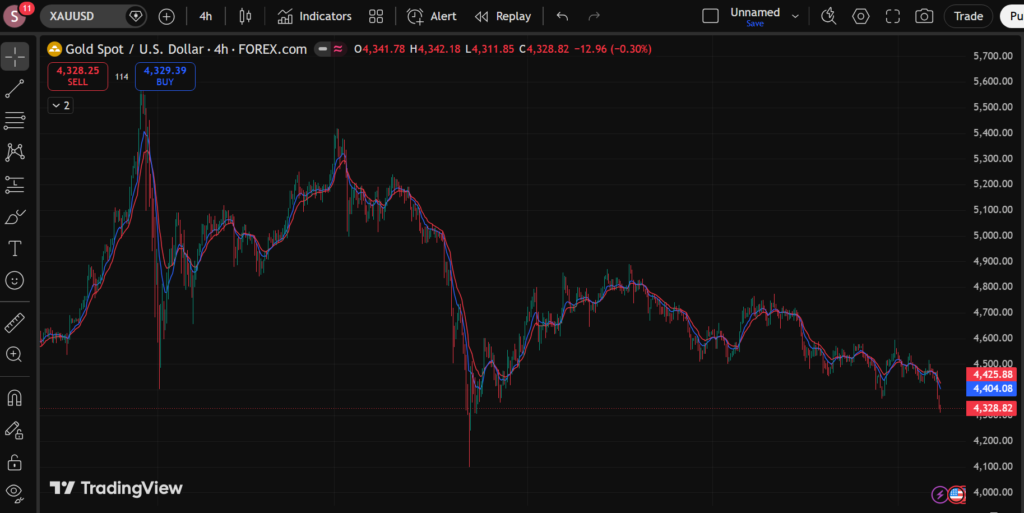
The 4-hour chart provides the broader market direction.
Key Observations
- Downtrend Structure Remains Intact Gold continues to form lower highs and lower lows, which is one of the strongest signs of a bearish market structure. If you’re new to market structure analysis, read our guide on Market Bias in Forex: Institutional Smart Money Guide to Directional Trading (SMC Concept)
- Moving Average Bearish Alignment The shorter moving average remains below the longer moving average, confirming downside momentum. Traders who want to understand moving averages in more detail can read: Moving Averages (EMA vs SMA): Complete Beginner Guide for Forex, Gold & Crypto Traders
- Strong Breakdown Candle A large bearish candle recently pushed prices below previous support areas, indicating aggressive institutional selling.
- Failed Recovery Attempts Every recent bullish bounce has been followed by renewed selling pressure.
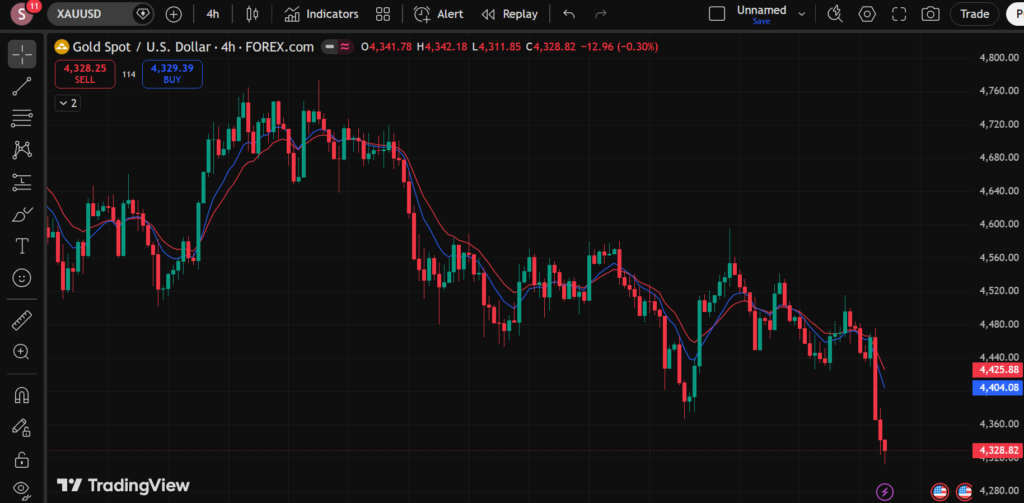
Important Support Levels
Current support zones that traders may monitor:
Support 1: 4320–4300
This is the immediate support area where buyers are attempting to slow the decline.
Support 2: 4280
If 4300 breaks decisively, the next major downside area could be around 4280.
Support 3: 4250
A deeper correction may expose this region as the next target. Support and resistance levels play a critical role in technical analysis. If you’re unfamiliar with these concepts, check out:
What Is Support and Resistance? Beginner Trading Guide (Easy Explanation)
Important Resistance Levels
Resistance 1: 4340–4350
The first resistance zone that may attract sellers.
Resistance 2: 4400–4425
A stronger resistance area where previous support has turned into resistance.
Resistance 3: 4460–4480
This area marked the beginning of the latest major decline and remains a key barrier for bulls.
What the 15-Minute Chart Shows
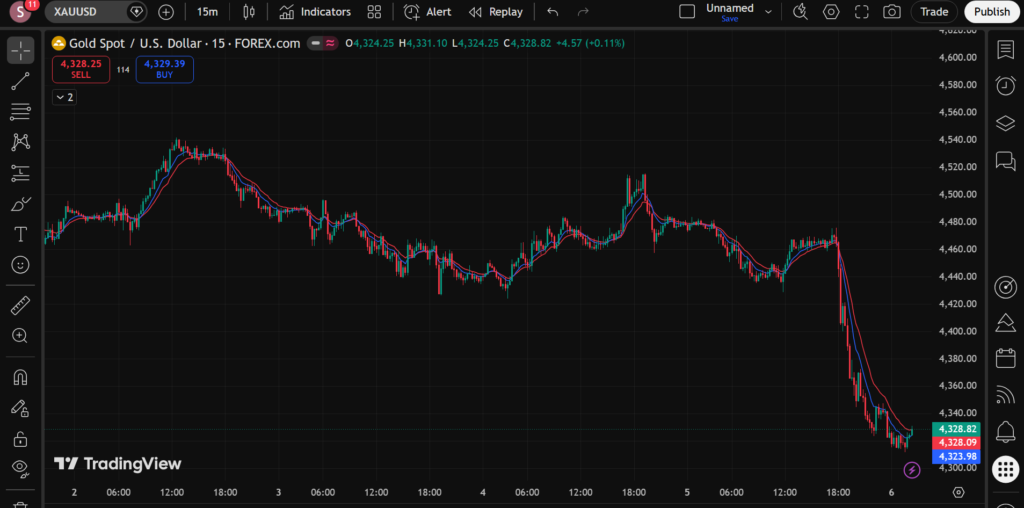
The 15-minute chart is useful for short-term traders and scalpers.
Key Findings
- The market experienced a sharp bearish impulse move.
- Price is currently attempting a small recovery.
- Moving averages are still pointing lower.
- No confirmed trend reversal pattern is visible yet.
The recent bounce appears to be a normal retracement within a larger downtrend rather than a confirmed bullish reversal.
Possible Trading Scenarios
Scenario 1: Bearish Continuation
If price remains below the 4340–4350 resistance zone, sellers may continue pushing gold lower.
A break below 4300 could increase bearish momentum and open the door for additional downside movement.
Scenario 2: Short-Term Recovery
If buyers manage to reclaim 4350 and hold above it, a temporary recovery toward 4400 may become possible.
However, traders should remember that the broader trend remains bearish until higher highs begin forming on the higher timeframes.
Risk Management Is More Important Than Predictions
Many traders focus only on predicting market direction. Professional traders focus equally on risk management.
Before entering any trade, consider:
- Position size
- Stop-loss placement
- Risk-to-reward ratio
- Market volatility
- Economic news releases
Even the best analysis can be wrong. Proper risk management helps protect trading capital during unexpected market movements.
Fundamental Factors Affecting Gold Prices
Gold prices are influenced by several economic and geopolitical factors, including:
1. US Dollar Strength
Gold often moves inversely to the US Dollar. A stronger dollar can create pressure on gold prices.
2. Interest Rate Expectations
Higher interest rates generally reduce the attractiveness of non-yielding assets like gold.
3. Inflation Data
Inflation reports can significantly impact gold demand as investors often view gold as a hedge against inflation.
4. Geopolitical Events
Political uncertainty, conflicts, and economic instability can increase demand for safe-haven assets such as gold.
5. Central Bank Activity
Purchases and sales by central banks can influence long-term gold trends.
Educational Note for Traders
Technical analysis provides probabilities, not guarantees.
Charts help traders identify:
- Trends
- Support levels
- Resistance levels
- Momentum shifts
- Potential entry and exit areas
However, no indicator or strategy can predict future prices with complete accuracy.
Successful trading requires:
- Discipline
- Patience
- Consistent risk management
- Continuous learning
If you’re new to technical analysis, these beginner resources may help:
Candlestick Patterns – How to Read Candlestick Charts for Beginners
Analyst’s View
Based on the current 4-hour and 15-minute chart structure, gold remains bearish while trading below the key resistance area around 4340–4350.
The recent recovery appears corrective rather than a confirmed trend reversal. Sellers continue to hold the advantage unless price can establish higher highs and reclaim important resistance levels.
Traders should watch price action carefully around the 4300 support area, as a decisive break could lead to further downside pressure.
Conclusion
The latest gold price analysis suggests that XAU/USD remains in a short-term and medium-term downtrend. The 4-hour chart continues to show bearish market structure, while the 15-minute chart reflects only a modest recovery after a strong sell-off.
Support levels around 4300 and 4280 will be important in the coming sessions, while resistance around 4350 and 4400 may determine whether buyers can regain momentum.
As always, traders should combine technical analysis with sound risk management and avoid making trading decisions based solely on a single chart or opinion.
Disclaimer: Trading forex and CFDs involves significant risk and may not be suitable for all investors. This article is for educational purposes only and should not be considered financial advice.
Written by Shah – Forex trader and market analyst at Forex News 360.
Related Gold Trading Guides
- Best Time to Trade XAUUSD (Gold) for Maximum Volatility
- Best Time to Trade Gold (XAUUSD) in India: Trading Hours & Strategy Guide
- London Session Strategy: How to Catch the Real Move Without Getting Trapped
- New York Session Trading Guide – How to Catch Real Moves in Forex & Gold (Without Overtrading)