Bitcoin Traders Trapped in Volatile $78K–$82K Range as BTC Fails to Break Higher – Full Market Breakdown
Bitcoin Traders Trapped in Volatile $78K–$82K Range: Bitcoin entered this week with strong bullish sentiment, but once again the market failed to establish a confirmed breakout above the psychological $80,000 resistance zone. Instead of a clean continuation rally, BTC spent most of the week trapped in a volatile consolidation structure between $78,500 and $82,000.
Institutional demand remained relatively stable, risk sentiment across global markets improved slightly, and traders expected Bitcoin to continue higher after the early May recovery. However, profit-taking pressure, weak breakout volume, and macro uncertainty prevented buyers from gaining full control.
This week became a textbook example of how psychological resistance levels behave in crypto markets.
Market Overview: What Happened This Week?
Bitcoin started the week near the $80K region after recovering from the heavy February–March selloff visible on the daily chart. Bulls attempted multiple breakout moves above $81K–$82K, but every rally faced immediate rejection.
The market structure across lower timeframes clearly showed:
- Buyers defending the $78.5K–$79K support region
- Sellers aggressively protecting the $80K–$82K supply zone
- Reduced momentum after impulsive rallies
- Increasing short-term volatility inside a range
This resulted in sideways movement rather than trend continuation.
The week was not completely bearish, but it also lacked the strength required for a confirmed breakout.
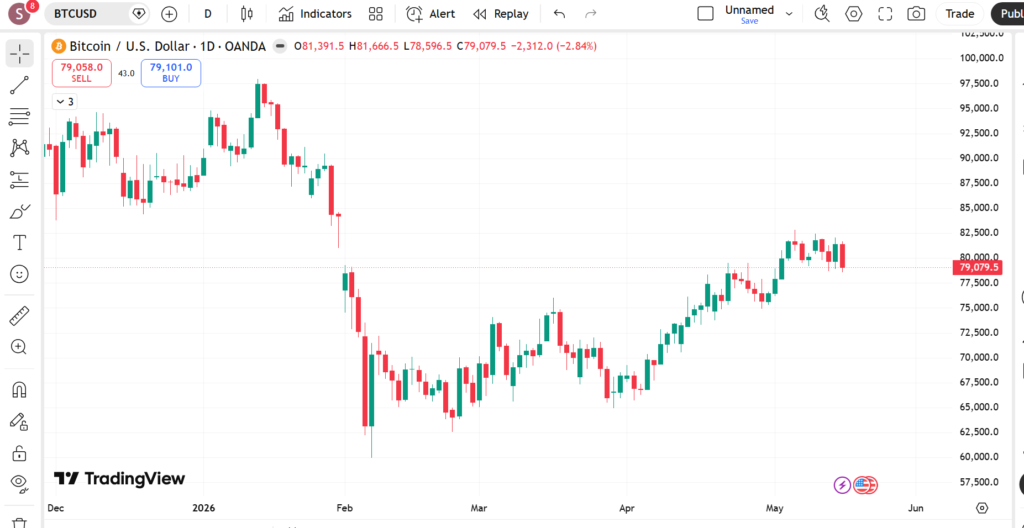
Daily Chart Analysis: Bitcoin Still Recovering From Larger Correction
The daily timeframe shows the broader market structure very clearly.
After the major February crash from the $90K+ region, Bitcoin formed a strong recovery trend during April and early May. Buyers managed to push price back toward the critical $80K resistance zone, but momentum started slowing near the top.
Key observations from the daily chart:
- BTC continues trading below the major resistance area near $82K
- Recovery structure remains intact above $75K
- Daily candles show weakening bullish momentum
- Several rejection wicks near resistance indicate heavy sell pressure
The market is currently in a “decision zone.”
If buyers successfully reclaim and close above the $82K region on the daily chart, Bitcoin could attempt another bullish expansion toward higher liquidity zones.
However, failure to maintain support above $78K could trigger another corrective move toward the $75K–$76K region.
The daily chart also reflects something important psychologically:
Many traders who bought the recovery rally are now taking profits near resistance, while new buyers hesitate to enter aggressively above $80K.
That hesitation is slowing the breakout attempt.
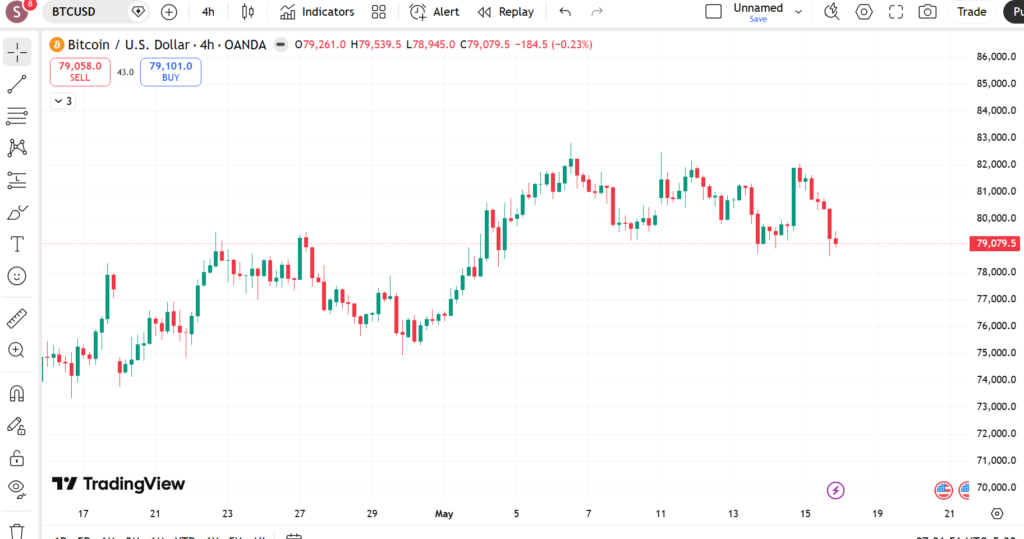
4-Hour Chart Analysis: Range-Bound Market Structure
The 4-hour chart explains why Bitcoin struggled throughout the week.
Price repeatedly moved between:
- Resistance: $81,500–$82,000
- Support: $78,500–$79,000
This created a classic range-bound environment.
Several breakout attempts above resistance failed quickly because buyers could not maintain momentum after initial impulsive candles. Volume also appeared weaker during upward pushes compared to previous recovery phases.
Meanwhile, every dip toward $79K attracted buyers again.
This means neither bulls nor bears had complete control.
The 4-hour structure currently favors short-term scalping and range-trading strategies rather than aggressive swing breakouts.
Traders who chased breakout candles without confirmation likely got trapped multiple times during the week.
Why Bitcoin Could Not Break Above $80K
The $80K region became a strong psychological barrier for several reasons:
1. Profit-Taking Pressure
After recovering significantly from March lows, many traders locked in profits near resistance.
Large holders often reduce exposure at major psychological levels because liquidity is high there.
2. Weak Breakout Volume
True bullish breakouts usually require aggressive volume expansion.
This week, several upward moves lacked strong follow-through volume, making breakouts unsustainable.
3. Macro Uncertainty
Although broader risk sentiment improved slightly, markets still remain cautious regarding:
- US interest rate expectations
- Inflation outlook
- Institutional crypto regulations
- ETF-related positioning
These factors reduced aggressive risk-taking behavior.
4. Liquidity Traps Around Resistance
Smart money often pushes price slightly above resistance before reversing sharply.
The charts show several fake breakout attempts that likely liquidated late buyers before price returned into range.
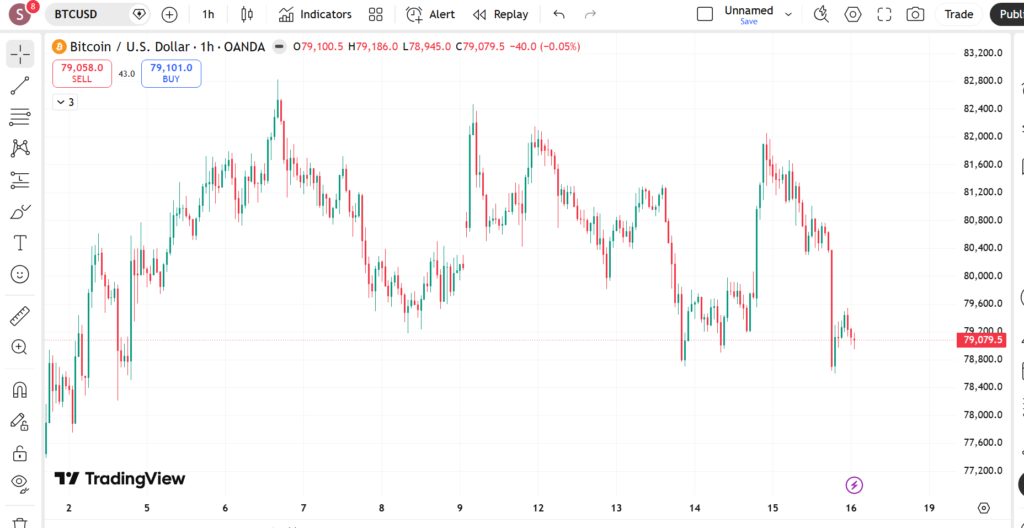
1-Hour Chart Analysis: Intraday Volatility Dominated the Week
The 1-hour chart reveals how unstable short-term sentiment became.
Key patterns visible:
- Sudden vertical spikes followed by immediate reversals
- Strong rejection candles near highs
- Repeated liquidity sweeps
- Momentum fading after every bullish expansion
This type of structure is common during indecisive markets.
The market repeatedly punished traders entering too late after emotional breakout candles.
Notice how multiple rallies toward $81K+ quickly reversed back below $80K. That behavior usually signals:
- exhaustion from buyers
- heavy algorithmic selling
- liquidity engineering by larger market participants
Short-term traders likely performed better using support-resistance strategies instead of breakout chasing.
Educational Insight: Best Strategy That Worked This Week
This week strongly favored:
Range Trading Strategy
Instead of trend-following, the best-performing strategy was buying support and selling resistance inside the established range.
Example Structure:
- Buy near: $78.5K–$79K support
- Take profit near: $81K–$82K resistance
- Avoid entering in the middle of the range
This strategy works best when:
- Price repeatedly rejects the same levels
- Momentum weakens near highs
- Volume decreases during breakout attempts
A major lesson from this week:
Not every market is trending.
Many traders lose money because they try forcing breakout trades inside consolidation zones.
Patience becomes more important than prediction during these periods.
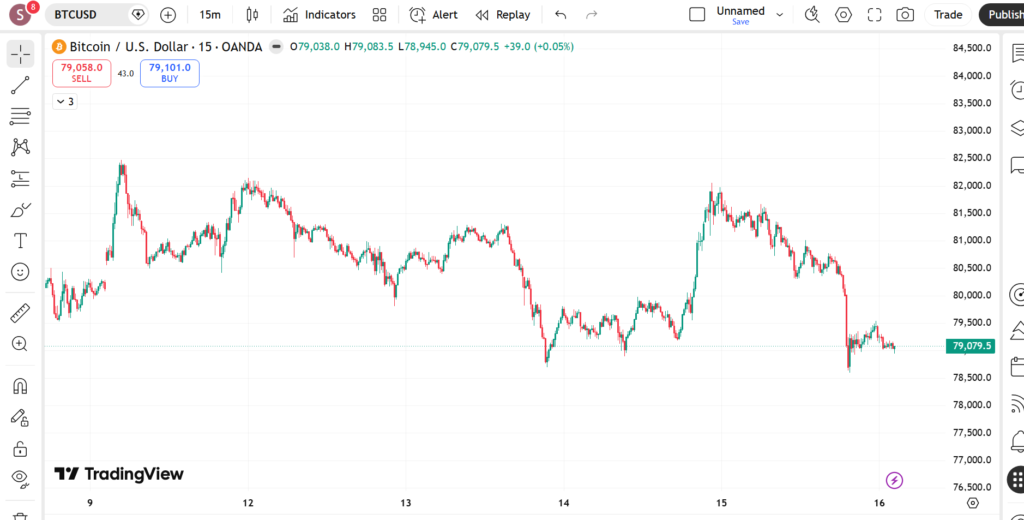
15-Minute Chart Analysis: Scalpers Controlled the Market
The 15-minute chart highlights aggressive short-term volatility.
Several fast intraday moves occurred throughout the week, especially around US trading sessions.
The chart shows:
- rapid selloffs
- fast recoveries
- stop-loss hunting behavior
- low follow-through after impulses
This environment favored:
- scalpers
- quick intraday traders
- disciplined risk management
It punished:
- overleveraged positions
- emotional entries
- late breakout traders
The sharp drop visible near May 15 likely triggered heavy liquidations before stabilizing again near the lower support region.
This confirms that institutional liquidity hunting remained active throughout the week.
Important Technical Levels Going Forward
Major Resistance Zones
- $80,000 psychological level
- $81,500–$82,000 supply region
Key Support Zones
- $78,500 short-term support
- $75,000 larger structural support
If BTC closes strongly above resistance with volume confirmation, bullish momentum could accelerate again.
If support fails, another deeper correction phase becomes possible.
Trading Psychology Lesson From This Week
This week was an excellent reminder that markets often move sideways longer than traders expect.
Many retail traders become impatient during consolidation and start overtrading.
Professional traders usually:
- wait for confirmation
- protect capital
- reduce leverage during choppy conditions
The ability to stay disciplined during uncertain market conditions is often more valuable than predicting direction.
Final Outlook
Bitcoin remains structurally stable above major recovery support levels, but the market clearly lacks enough momentum to confidently break above $80K–$82K resistance.
The coming breakout direction will likely depend on:
- institutional participation
- macroeconomic news
- risk appetite across global markets
- volume confirmation
For now, Bitcoin remains trapped inside a high-volatility consolidation phase.
Until a confirmed breakout or breakdown occurs, traders should expect continued sideways movement with sharp short-term volatility.
Disclaimer: Trading forex and CFDs involves significant risk and may not be suitable for all investors. This article is for educational purposes only and should not be considered financial advice.
Written by Shah – Forex trader and market analyst at Forex News 360.