Bitcoin Support and Resistance Levels – Day Wise Analysis for April 2026
Bitcoin Continues Recovery Momentum in April 2026
Bitcoin (BTC) has shown steady recovery strength throughout April 2026 after spending the previous months moving inside a wide consolidation range. During February and March, the market struggled to build momentum as buyers and sellers fought around major price levels. However, April has started showing a clearer bullish structure as Bitcoin slowly climbed higher and reclaimed important resistance zones.
One interesting pattern visible on the chart is the “staircase recovery.” Instead of moving straight upward in one aggressive rally, Bitcoin has been gradually forming higher support levels while testing new resistance areas step by step. This type of price action is often considered healthier than sudden vertical moves because it allows the market to build stronger support along the way.
At the moment, Bitcoin is trading near the critical $75,000 region, which has become one of the most important battlegrounds for traders during April.
Bitcoin Day-Wise Support and Resistance Breakdown
April 1–5: Bitcoin Holds Major Support Near $66K
At the beginning of April, Bitcoin traded between $66,500 and $67,100. This zone acted as strong support during early-month volatility.
Despite uncertainty in the market, buyers defended the $66,000 level successfully. Holding above this support helped prevent a larger bearish breakdown and gave the market a foundation for recovery.
Strong support zones often become important turning points in trending markets.
April 6–10: Resistance Forms Near $70K
During the second week of April, Bitcoin moved toward the $69,000–$71,000 region.
However, the $70K level acted as strong resistance for several days. Sellers repeatedly entered the market around this area, stopping Bitcoin from breaking higher immediately.
Psychological price levels like $70,000 often attract increased trading activity because both retail and institutional traders monitor them closely.
Although resistance held temporarily, Bitcoin continued building pressure underneath the zone.
April 11–13: Resistance Turns Into Support
One of the strongest bullish signals appeared when Bitcoin finally broke above $71,000.
After the breakout, the market successfully held above the previous resistance zone, turning it into new support. In technical analysis, this is commonly called a “support and resistance flip.”
When old resistance becomes support, it often signals improving market strength and increased buyer confidence.
This breakout helped Bitcoin continue climbing toward higher price levels later in the month.
April 14–16: Bitcoin Faces Resistance Near $75K
As bullish momentum continued, Bitcoin reached the $74,400–$75,100 area.
This region quickly became a major resistance zone as selling pressure increased again. Many traders believe large short positions are currently sitting near these levels, making the area important for short-term market direction.
Resistance zones near major psychological levels often create increased volatility and rapid price swings.
At the moment, Bitcoin continues testing this area while traders wait for confirmation of either a breakout or rejection.
April 17: Current Market Pivot
Bitcoin is currently trading around $75,300 and attempting to hold above the 100-day Exponential Moving Average (EMA), which sits near $75,260.
Moving averages are widely used technical indicators that help traders identify market trends and momentum.
Holding above the 100-day EMA may strengthen bullish sentiment, while failure to maintain support could lead to temporary downside pressure.
This level is now acting as the immediate pivot zone for Bitcoin’s next move.
Major Bitcoin Levels to Watch for the Rest of April
Important Resistance Levels
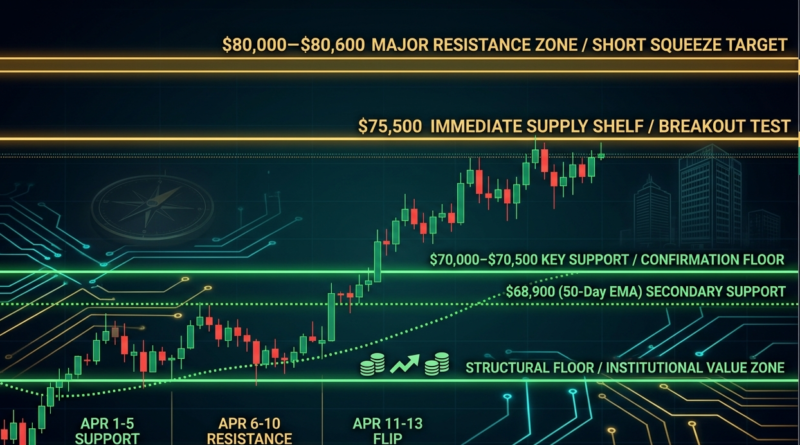
$75,500 – Immediate Resistance
The $75,500 area is currently the closest resistance level for Bitcoin.
If BTC manages to close multiple daily candles above this region, many traders may view it as confirmation of a breakout. Strong closes above resistance usually increase market confidence and can attract additional buying pressure.
$80,000 – $80,600: Major Breakout Target
The $80K region remains one of the biggest psychological targets in the market.
This area previously acted as an important breakout base and could become the next major destination if bullish momentum continues.
A move toward $80K may also trigger a short squeeze, where traders betting against Bitcoin are forced to close their positions, adding more buying pressure to the market.
Important Support Levels
$70,000 – $70,500: Primary Support Zone
This remains one of the most important support areas for Bitcoin during April.
As long as BTC stays above this region, the broader bullish recovery structure remains intact.
Strong support zones often attract buyers during temporary market pullbacks.
$68,900 – The 50-Day EMA
If Bitcoin falls below $70K, traders will closely watch the 50-day EMA near $68,900.
The 50-day moving average is commonly used to measure medium-term trend strength. Holding above it usually supports bullish momentum.
$62,000 – $65,000: Long-Term Value Zone
This region acted as a strong accumulation area earlier in 2026.
Whenever Bitcoin traded inside this range, institutional buyers and ETF-related inflows appeared to support the market.
Because of this, many long-term investors still consider this area an important value zone for Bitcoin.
Final Thoughts
Bitcoin’s performance throughout April 2026 shows a clear shift from uncertainty toward recovery. The market has gradually moved from defending support near $66K to testing major resistance around $75K.
The next major challenge now sits near the $75,500 level. A successful breakout above this area could open the path toward the important $80,000 target. On the other hand, failure to break resistance may lead to a temporary pullback toward lower support zones before another recovery attempt.
For traders, patience remains important while Bitcoin trades near key resistance. Instead of chasing price in the middle of volatile moves, many market participants prefer waiting for confirmation near major support and resistance areas.