RSI Indicator Explained | Overbought & Oversold Strategy for Trading
RSI (Relative Strength Index) – Complete Beginner Guide
What is RSI?
The Relative Strength Index (RSI) is a momentum oscillator used in technical analysis to measure the speed and strength of price movements.
It helps traders identify whether an asset is:
- Overbought (too high, possible reversal down)
- Oversold (too low, possible reversal up)
RSI is widely used in Forex, Gold (XAUUSD), Bitcoin, and stock trading.
RSI Formula Concept (Simple Explanation)
RSI=100−1+RS100
Where:
- RS = Average Gain / Average Loss over a set period (usually 14 candles)
You don’t need to calculate it manually—trading platforms do it automatically.
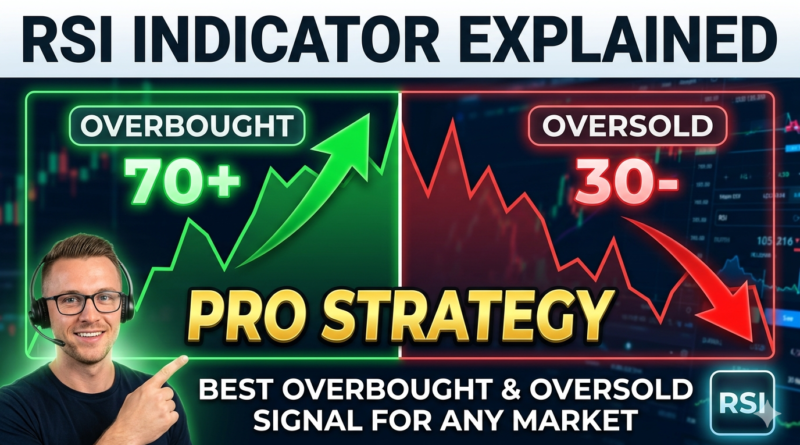
RSI Scale (0 to 100)
RSI moves between 0 and 100, and traders use key levels:
- Above 70 → Overbought
- Below 30 → Oversold
- 50 → Neutral trend zone
What is Overbought?
When RSI goes above 70, it means:
- Price has risen too fast
- Buying pressure is very strong
- Market may be overextended
Trading Meaning:
- Possible reversal down
- Or short-term pullback
⚠️ Important: Overbought does NOT always mean immediate sell signal in strong trends.
What is Oversold?
When RSI falls below 30, it means:
- Price has dropped sharply
- Selling pressure is strong
- Market may be undervalued short-term
Trading Meaning:
- Possible reversal up
- Or short-term bounce
How Traders Use RSI
1. Reversal Trading
- RSI > 70 → Look for sell setups
- RSI < 30 → Look for buy setups
2. Trend Confirmation
- RSI above 50 → Bullish trend
- RSI below 50 → Bearish trend
3. RSI Divergence Strategy
One of the strongest signals:
- Price makes higher high, RSI makes lower high → Bearish divergence
- Price makes lower low, RSI makes higher low → Bullish divergence
This often signals trend reversal early.
RSI Settings
- Default setting: 14 periods
- Scalping: 7–10 periods (faster signals)
- Swing trading: 14–21 periods (more stable signals)
RSI in Real Markets
Forex
- Helps detect reversals in EURUSD, GBPUSD, USDJPY
Gold (XAUUSD)
- Very effective in identifying pullbacks during strong trends
Crypto (Bitcoin)
- Useful for spotting volatility-based reversals
Limitations of RSI
- Can stay overbought/oversold in strong trends
- Not reliable alone (must combine with trend or support/resistance)
- False signals in sideways markets
Best Strategy Combination
RSI works best when combined with:
- Moving Averages (trend direction)
- Support & Resistance levels
- Price action (candlestick patterns)
Conclusion
RSI is a powerful momentum indicator that helps traders identify overbought and oversold conditions in the market. While it is not perfect alone, combining RSI with trend analysis significantly improves trading accuracy in Forex, Gold, and Crypto markets.