XAUUSD Forecast : Gold Pullback After Strong Rally – Key Levels to Watch
Gold (XAU/USD) is entering the third week of April with an important short-term shift in momentum. After a strong and fast rally in the previous sessions, the market is now showing signs of a pullback.
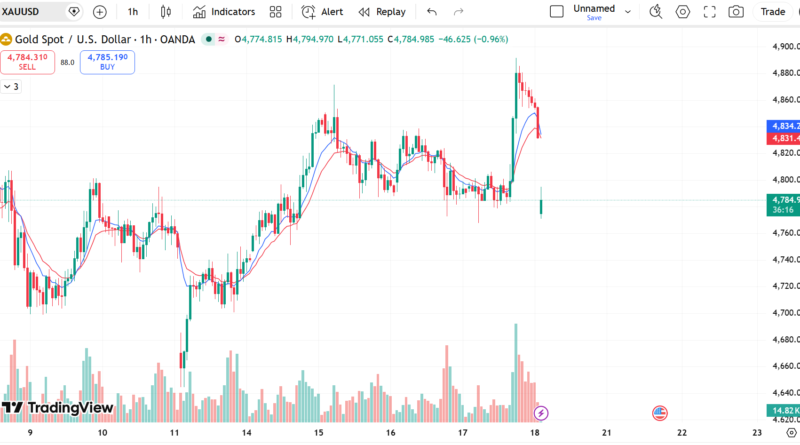
Price recently moved close to the $4,870–$4,880 resistance zone, but buyers failed to push higher. As a result, Gold is now cooling down and trading slightly lower around the $4,785 area.
Even though the short-term chart is showing weakness, the overall bigger trend is still bullish. This means the current move is more likely a correction rather than a full reversal.
In simple words, the market is taking a break after a strong run.
What Is Happening in the Market Right Now?
If we look at the 1-hour chart, Gold recently showed strong buying pressure that pushed the price aggressively upward. However, once it reached the $4,870–$4,880 zone, sellers stepped in.
This area acted like a strong resistance level where many traders likely took profits.
After that rejection, the market started moving lower step by step. This type of movement is common after a strong rally.
Right now, we can see:
- Buyers losing short-term control
- Sellers pushing price down slowly
- Market moving into a correction phase
- Price testing important support levels
The current behavior suggests that the market is trying to find a fair value area before making its next big move.
Why Is Gold Pulling Back?
There are a few simple reasons behind this pullback:
1. Profit Taking
After a strong rally, many traders close their buy positions to secure profits. This creates temporary selling pressure.
2. Resistance Rejection
The $4,870–$4,880 zone acted as a strong resistance. The price struggled to break above it, leading to rejection.
3. Market Cooling Phase
Markets rarely move in a straight line. After strong upward movement, a cooling phase or pullback is very normal.
4. Short-Term Momentum Shift
Indicators like moving averages on the 1-hour chart are starting to flatten. This shows that bullish momentum is slowing down in the short term.
Current Price Structure (Simple View)
At the moment, Gold is trading around $4,785.
The structure looks like this:
- Recent High: $4,870–$4,880
- Current Price: ~$4,785
- Short-term direction: Slightly bearish
- Overall trend: Still bullish (higher timeframe)
This means we are in a temporary pullback inside a bigger uptrend.
Key Levels to Watch Today
Understanding key levels is very important for intraday movement. These levels act like decision zones for buyers and sellers.
🔴 Resistance Levels (Where price may struggle to go up)
$4,820 – $4,835
- First resistance zone
- Price may face selling pressure here
- A break above this level would show strength returning
$4,870
- Major resistance level
- This is the recent high
- A breakout above this could lead to a strong bullish continuation
🟢 Support Levels (Where price may hold or bounce)
$4,780
- Immediate support
- Current battleground between buyers and sellers
- If this breaks, downside pressure may increase
$4,760 – $4,755
- Strong demand zone
- Previous consolidation area
- High chance of buyers stepping in here
This zone is very important because it may decide whether the pullback ends or continues further.
Short-Term Market Outlook (Today)
For today’s trading sessions, the market outlook is slightly bearish to neutral.
This means:
- Price may continue to move lower slowly
- Sellers have short-term control
- But downside may be limited due to strong support zones
If there are no major economic news events, technical movement is likely to dominate the market.
In simple terms, Gold may drift lower but not collapse aggressively.
Possible Market Scenarios
Let’s break it down into two simple scenarios:
📉 Scenario 1: Bearish Continuation (Short-Term)
If price breaks below $4,780 and stays below it, we may see:
- Continued selling pressure
- Price moving toward $4,765
- Possibly testing $4,760 support zone
This scenario confirms that sellers are still active in the short term.
📈 Scenario 2: Bullish Reversal (Buy the Dip)
If price reaches the $4,755–$4,765 zone and buyers step in, we may see:
- Strong bounce from support
- Recovery back toward $4,820
- Possible retest of $4,835 resistance
This scenario supports the idea that the uptrend is still active.
What Traders Should Focus On Today
Instead of trying to predict the exact direction, traders should focus on key reaction zones.
Here is a simple approach:
- Watch $4,780 carefully for breakdown or rejection
- Avoid chasing price in the middle of the range
- Wait for support zone reactions before taking action
- Let the market show direction before entering
Patience is more important than prediction in this kind of market.
Bigger Picture Trend (Important)
Even though we are seeing a pullback, the higher timeframe trend still remains bullish.
This means:
- Long-term structure is still strong
- Buyers have not lost control completely
- This move looks like a correction inside an uptrend
So unless $4,755 breaks strongly, the broader bullish structure is still valid.
Final Summary
Gold is currently in a short-term pullback after a strong rally toward the $4,880 resistance zone. The market is now cooling down and testing important support levels around $4,780 and $4,760.
Today’s movement is likely to remain range-bound with a slightly bearish bias in the short term. However, this is not a trend reversal. It is more likely a healthy correction inside a larger bullish structure. The $4,760 zone will be very important. If it holds, Gold may continue its upward trend later in the week. If it breaks, we may see a deeper pullback before any new rally.
Disclaimer: Trading forex and CFDs involves significant risk and may not be suitable for all investors. This article is for educational purposes only and should not be considered financial advice.
Written by Shah – Forex trader and market analyst at Forex News 360.