Gold Price Prediction: XAUUSD Deep Dive and April Analysis
The global gold market (XAU/USD) is navigating a massive structural turning point. After hitting a staggering historic high of $5,589 in January, the precious metal has entered a high-stakes consolidation phase. Traders and long-term investors alike are trying to map out a clear gold price prediction as the market balances shifting geopolitical realities against fierce technical chart resistance.
If you are trading XAU/USD or holding physical bullion, understanding the core drivers behind this month’s price action is critical. Let’s dig deep into the technical chart structures, institutional movements, and global catalysts dictating where gold goes next.
Technical Analysis: XAU/USD Outlook
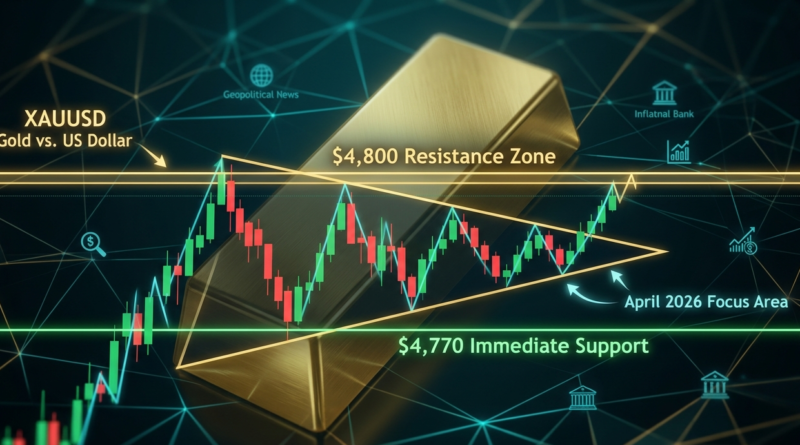
Currently, the spot price of gold is carving out a tight range, hovering precisely around the $4,790–$4,810 per ounce corridor. While the metal experienced a notable pullback from its Q1 highs, the broader multi-month technical structure remains cautiously bullish—provided buyers can defend key foundational support levels.
[XAU/USD Technical Range]
   $5,589 (All-Time High / Major Resistance)
     ▲
     │   (Bullish Target if $4,870 breaks)
     ▼
   $4,870 (Immediate Trend Resistance)
   $4,790 - $4,810 (Current Pivot/Consolidation Zone)
   $4,770 (Immediate Trendline Support)
     ▲
     │   (Bearish Drop Zone if trendline fails)
     ▼
   $4,300 (Major 200-Day Moving Average Support)
Key Resistance Levels ($4,800–$4,870)
Gold is facing heavy supply near the psychological $4,800 mark. However, the true line in the sand for a bullish continuation sits at $4,870.
A successful daily and weekly close above $4,870 would serve as a powerful trend reversal trigger. If momentum buyers step in on heavy volume above this point, it invalidates the recent correction and reopens a clear technical path toward testing the lifetime high of $5,589.
Crucial Support Levels ($4,770–$4,300)
On the downside, bears are actively trying to crack an immediate rising trendline tracked near $4,770. If day traders fail to defend this short-term floor, a deeper correction is likely.
Should the $4,770 level disintegrate, the next major structural floor sits significantly lower at the $4,300 zone. This area is highly significant because the 200-day simple moving average (SMA) is currently flattening out here, serving as the definitive macro boundary between a long-term bull market and a cyclical bear market.
The Macro Consolidation Phase
From a bird’s-eye perspective, the market is effectively trapped within a massive trading range bounded by $4,300 on the bottom and $5,600 on the top. Until XAU/USD achieves a clean, high-volume breakout sustained above $4,900, swing traders should expect frequent, choppy, “sawtooth” price action.
Fundamental Market Drivers: What is Moving Gold?
No accurate gold price prediction can rely solely on chart patterns. The volatility shaping the market is being fueled by heavy macroeconomic and geopolitical crosscurrents.
1. Geopolitical Headlines and De-escalation Dips
Safe-haven premiums have fluctuated heavily due to shifting headlines out of Western Asia. Rumors of potential ceasefire framework extensions have periodically cooled the urgent, defensive demand for bullion.
Additionally, any temporary ease in geopolitical friction tends to pull down global crude oil prices. Because lower energy costs blunt immediate, short-term inflation fears, it mechanically removes one of gold’s primary upward catalysts.
2. Supply Chains and the Strait of Hormuz
Despite intermittent moments of diplomatic progress, the ongoing naval friction around the Strait of Hormuz keeps a stubborn “risk premium” permanently priced into hard assets.
With oil hovering at elevated levels, energy-driven inflation has kept global consumer price indexes hot. If talks stall entirely and shipping disruptions escalate, commodity analysts anticipate a fresh wave of panic-buying capable of driving spot gold right back toward the $5,000 psychological milestone.
3. Institutional Accumulation On the Dips
One of the most encouraging signs for long-term gold bulls is the behavior of “smart money.” Standard exchange-traded fund (ETF) metrics show that asset managers and major funds are treating recent price pullbacks as accumulation windows.
Furthermore, central banks continue to buy bullion in bulk to diversify away from fiat currency reserves. This institutional floor shows that major financial players view the price dip as a healthy mid-market correction rather than a structural collapse.
Comprehensive Gold Price Prediction: Bullish vs. Bearish Cases
To help map out risk management strategies, we can formulate two distinct structural pathways for XAU/USD performance moving forward.
The Bullish Case: Target $5,100+
In this scenario, international diplomatic talks stall completely, causing an immediate spike in crude oil and energy supply lines. If subsequent inflation data surprises heavily to the upside, the Federal Reserve and other central banks will find themselves stuck in a stag flationary loop, where inflation remains high but economic growth slows.
As real yields drop under the weight of uncooled inflation, capital will flood out of sovereign bonds and back into precious metals, forcing a breakout above $4,870 to challenge $5,100 before structural resistance slows the advance.
The Bearish Case: Target $4,550
Conversely, if a comprehensive, legally binding peace treaty is signed, the geopolitical risk premium evaporates instantly. Oil prices would rapidly normalize, pulling down global inflation metrics.
If inflation drops faster than expected while central banks choose to keep interest rates restrictive and high, the opportunity cost of holding non-yielding assets like gold increases. This shift would likely trigger a wave of liquidation, driving XAU/USD straight through the $4,770 trendline to retest deeper structural support at $4,550.
Reference Matrix for XAU/USD Traders
To assist your daily charting and market execution, keep a close eye on these vital price coordinates:
| Level Type | Price Point (USD) | Technical Significance | Strategic Action |
| Major Resistance | $5,589 | All-Time High | Ultimate target for long-term macro bulls. Heavy supply expected. |
| Immediate Resistance | $4,870 | Trend Reversal Trigger | A daily close above this level confirms a bullish breakout. |
| Current Pivot | $4,790 | Market Balance Point | The local equilibrium zone. Expect volatile consolidation here. |
| Immediate Support | $4,770 | Short-term Trendline | The vital line for day traders; breaking this opens the door for bears. |
| Major Support | $4,300 | 200-Day Moving Average | The ultimate macro floor. Long-term buy zone for structural investors. |
Final Takeaway for April and Beyond
As we balance the evidence for our gold price prediction, the message from the market is clear: watch the $4,800 price point with extreme discipline.
A definitive “break and hold” pattern above this psychological ceiling is the exact structural signal that institutional trend-followers and momentum algorithms are waiting for. Until that macro breakout occurs, keep your position sizes controlled, protect your downside at $4,770, and treat the current choppy trading environment as a healthy accumulation phase for the next major secular move.
Disclaimer: Trading forex and CFDs involves significant risk and may not be suitable for all investors. This article is for educational purposes only and should not be considered financial advice.
Written by Shah – Forex trader and market analyst at Forex News 360.