
Why Gold Crashed on Friday and What Traders Learned This Week
Gold Weekly Analysis: Gold prices had a volatile and emotional trading week as traders reacted to changing market sentiment, stronger U.S. Dollar flows, profit-taking, and shifting expectations around interest rates. After attempting to stabilize earlier in the week, Gold (XAU/USD) lost momentum and faced heavy selling pressure into Friday’s session.
The sharp decline surprised many retail traders, especially those expecting Gold to continue its long-term bullish trend. However, when we break down the charts across multiple timeframes, the price action tells a very clear story.
What Happened to Gold This Week?
At the beginning of the week, Gold attempted to hold above important short-term support zones. Buyers initially defended the market, but momentum slowly weakened as the week progressed.
Several factors pressured Gold lower:
- Stronger U.S. Dollar demand
- Profit-taking after previous rallies
- Reduced safe-haven buying
- Rising Treasury yields
- Traders becoming cautious before major economic events
By Friday, sellers completely controlled the market. The move lower accelerated after key support zones failed, creating panic selling and fast bearish momentum across lower timeframes.
Why Did Gold Fall on Friday?
Friday’s sell-off was mainly driven by three important market reactions:
1. Stronger U.S. Dollar
Gold usually moves opposite to the U.S. Dollar. As the Dollar strengthened, traders moved money away from Gold and into USD-related assets.
A stronger Dollar makes Gold more expensive for international buyers, which often reduces demand.
2. Technical Breakdown Below Support
Once Gold lost the short-term support area around 4680–4660, sellers became aggressive.
This triggered:
- Stop-loss hunting
- Algorithmic selling
- Short-term panic exits
After that breakdown, the market quickly dropped toward the 4540 region.
3. Profit Booking Before Weekend Risk
Large institutional traders often reduce exposure before weekends when geopolitical or economic risks remain uncertain.
Since Gold had already experienced strong volatility in recent months, many traders locked in profits instead of holding positions into the weekend.
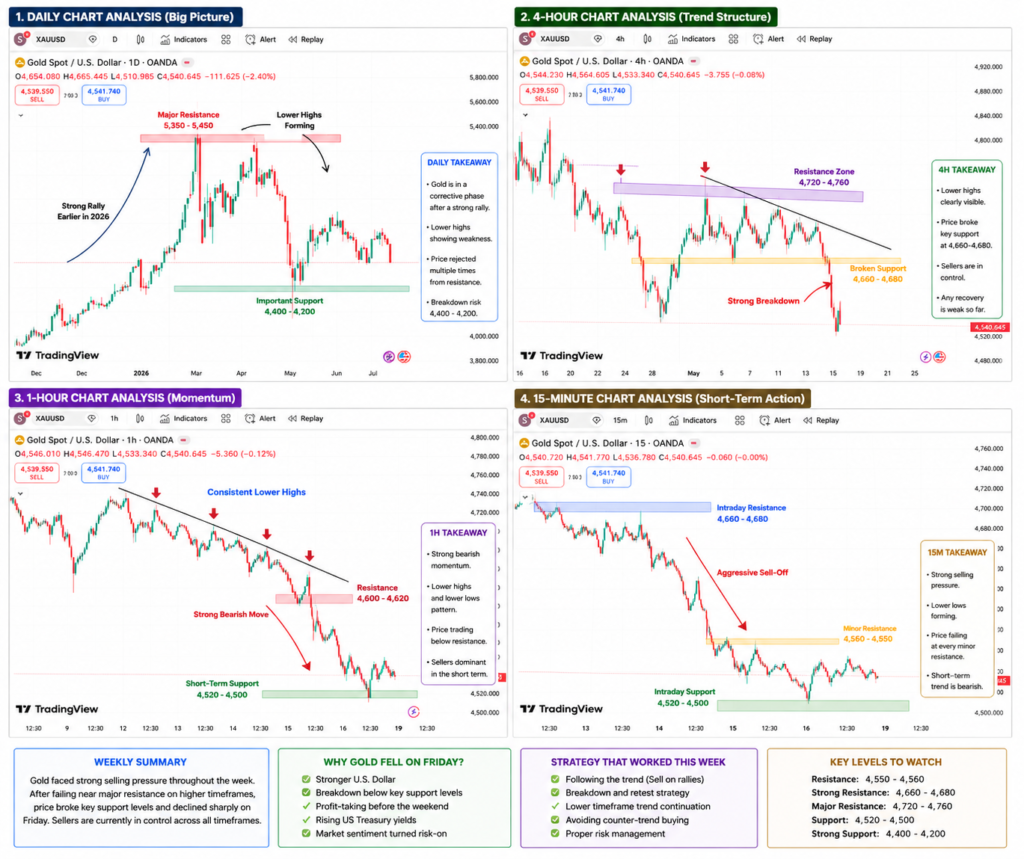
Daily Chart Analysis (Big Picture Trend)
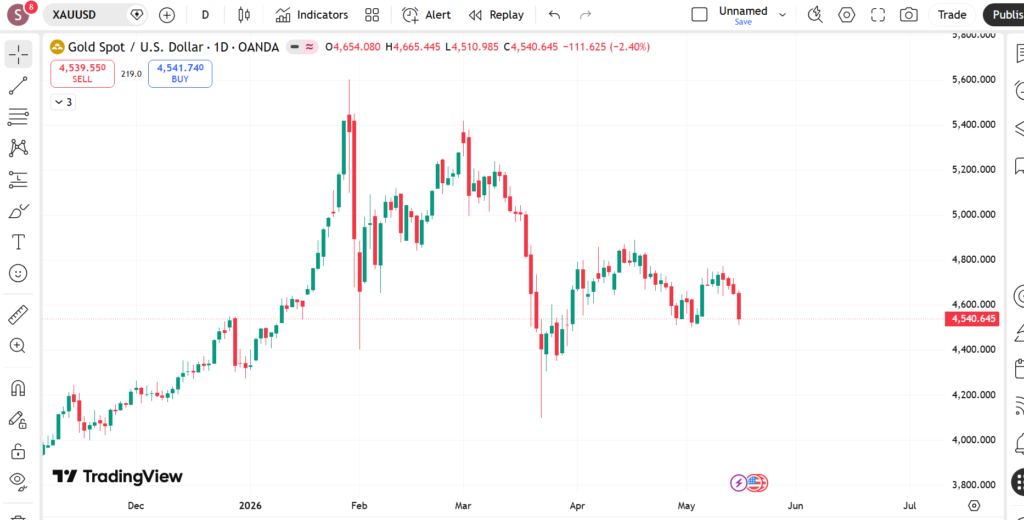
The daily chart shows that Gold is currently in a corrective phase after its massive bullish rally earlier in 2026.
Important observations from the daily chart:
- Price failed multiple times near the 4800 area
- Lower highs started forming
- Buyers lost momentum gradually
- Bearish candles increased near resistance
The current structure suggests that the market is no longer in an aggressive uptrend. Instead, Gold appears to be transitioning into a medium-term consolidation or correction phase.
Key Daily Levels
- Major Resistance: 4700–4800
- Important Support: 4500–4480
- Breakdown Zone: 4600
If Gold remains below the recent resistance area, sellers may continue controlling short-term direction.
4-Hour Chart Analysis (Market Structure Shift)
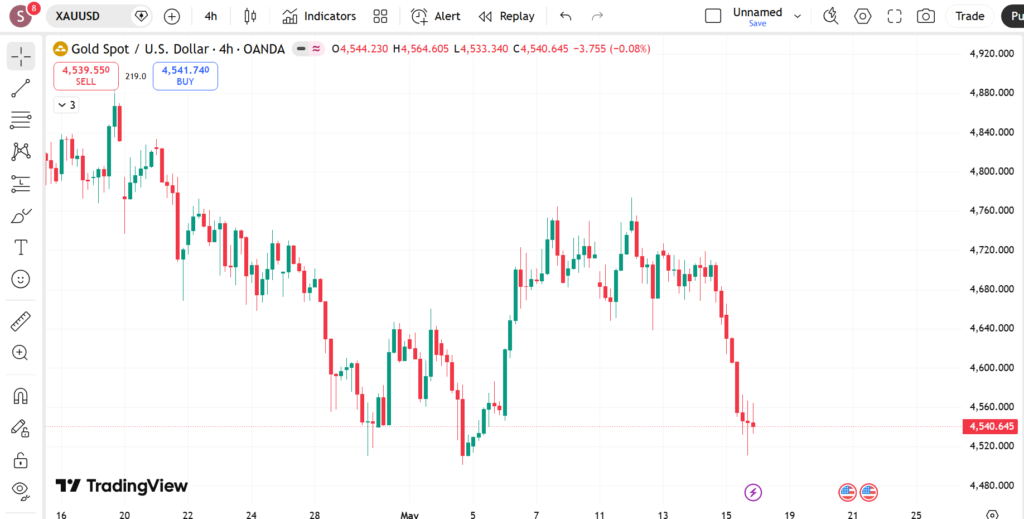
The 4-hour chart clearly shows where market sentiment changed.
Earlier in the week:
- Buyers attempted recovery
- Price formed temporary consolidation
- Bulls tried to defend support
However, the structure weakened after repeated rejection near 4720–4760.
Eventually:
- Support zones failed
- Lower highs formed
- Momentum shifted bearish
Friday’s breakdown confirmed seller dominance on the H4 timeframe.
What Traders Learned From the 4H Chart
The best strategy during the week was:
- Selling rallies instead of buying dips
- Waiting for support breakdown confirmation
- Following trend momentum instead of predicting reversals
Many losing traders tried catching the bottom too early. The market repeatedly punished aggressive countertrend buying.
1-Hour Chart Analysis (Momentum Collapse)
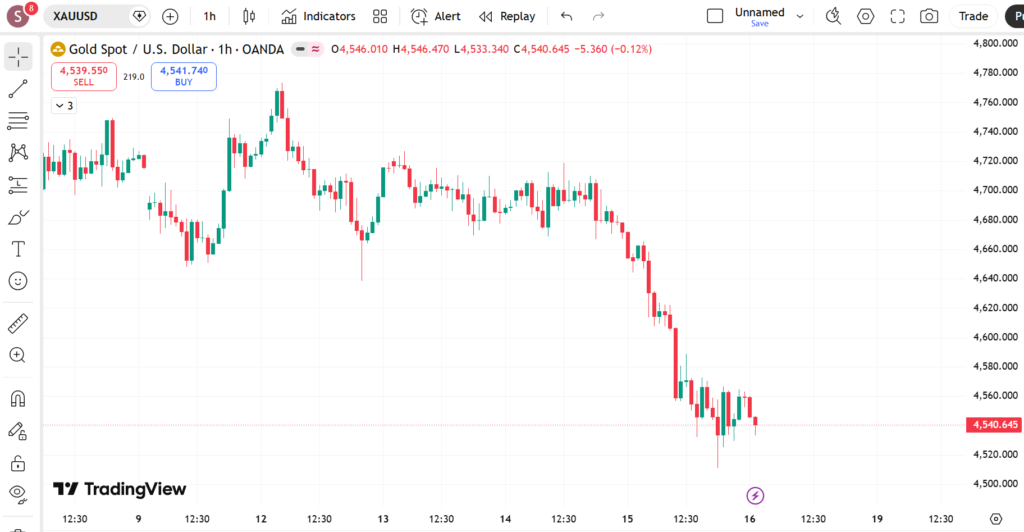
The hourly chart reveals how quickly bearish momentum accelerated.
Key observations:
- Strong bearish candle sequences
- Very weak bullish recoveries
- Continuous lower highs
- Momentum selling during U.S. session
This timeframe was extremely important for intraday traders because it provided early confirmation that sellers were taking control before the larger move happened.
Best Intraday Strategy This Week
Successful traders likely used:
- Trend-following strategies
- Pullback entries
- Break-and-retest setups
- Tight risk management
Trying to trade against momentum during Friday’s session was very risky.
15-Minute Chart Analysis (Scalping & Volatility)
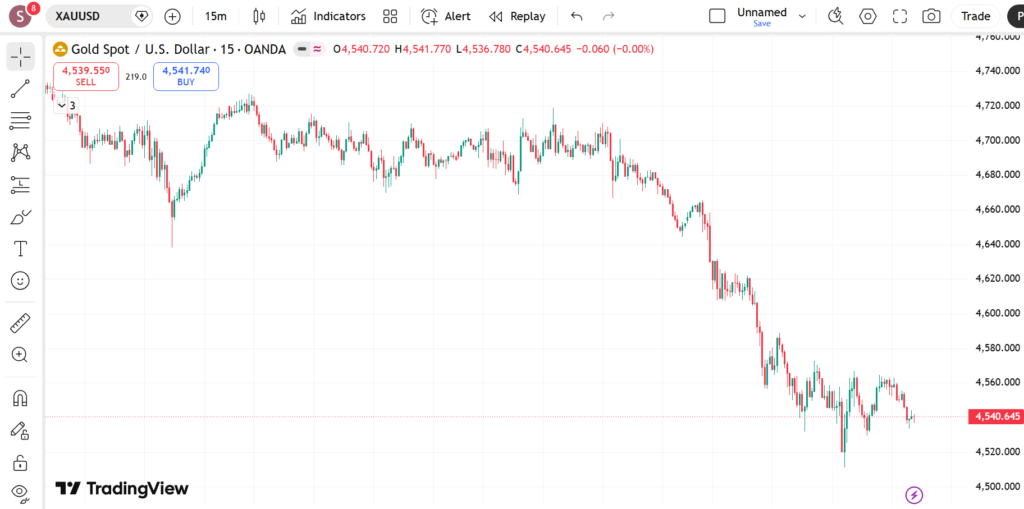
The 15-minute chart highlights how aggressive the sell-off became during the final sessions of the week.
Short-term traders saw:
- Fast bearish momentum
- Repeated support failures
- Small recovery candles with weak buying pressure
- Strong continuation moves after every pullback
This was a classic momentum-driven market.
What Worked Best on Lower Timeframes
The most effective strategy was:
- Trading with the trend
- Avoiding emotional revenge trades
- Waiting for pullbacks before entering sells
- Respecting stop-loss discipline
Scalpers who chased late entries likely experienced difficult conditions because volatility increased sharply near the lows.
Important Market Psychology Lesson From This Week
One major lesson from this week is that markets do not move in one direction forever.
Even though Gold remains strong in the long-term macro picture, short-term corrections can still become extremely aggressive.
Many traders become emotionally attached to bullish narratives during strong rallies. This week reminded traders why:
- Risk management matters
- Confirmation matters
- Patience matters more than prediction
Outlook for Next Week
Gold now enters next week under bearish pressure.
Traders will watch:
- U.S. economic data
- Federal Reserve expectations
- Treasury yields
- Dollar strength
- Global geopolitical developments
If Gold remains below the recent broken support zones, sellers could attempt another move lower toward deeper support areas.
However, if buyers reclaim momentum above resistance levels, the market could stabilize again.
The next few sessions will likely determine whether this was:
- A temporary correction
or - The beginning of a larger bearish phase
Final Thoughts
This week’s Gold movement was a strong example of how quickly sentiment can change in financial markets.
The charts across every timeframe showed the same message:
- Buyers were losing strength
- Sellers gained momentum gradually
- Friday confirmed bearish control
Traders who respected trend direction and managed risk carefully had the best chance of success during this volatile week.
For next week, patience and discipline will remain more important than aggressive predictions.
Disclaimer: Trading forex and CFDs involves significant risk and may not be suitable for all investors. This article is for educational purposes only and should not be considered financial advice.
Written by Shah – Forex trader and market analyst at Forex News 360.