XAUUSD Gold Analysis : 4H Chart Outlook, Trading Strategy
XAUUSD Gold Analysis has started the third week of April with a calm and controlled market structure after recent volatility. The market is not moving aggressively right now. Instead, it is showing a consolidation phase, which is very common after strong price swings.
As the Asian session transitions into the European session, traders are carefully watching the $4,790 to $4,810 range. This zone is currently acting as a key decision area for the market. The next directional move will likely come once price breaks or rejects this range clearly.
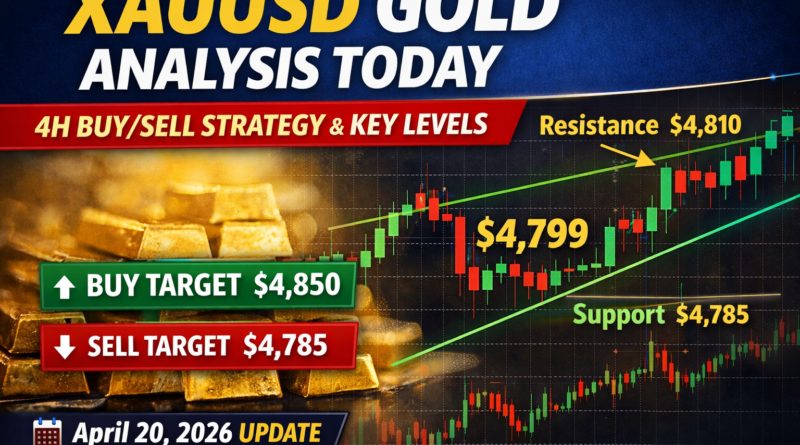
At the moment, Gold is trading around $4,799 and is struggling to break above short-term resistance. This suggests that the market is still undecided in the very short term, even though the broader trend remains relatively stable.
Current Market Structure (4H Chart Overview)
If we look at the 4-hour chart, Gold has been recovering after previous sharp volatility. The recent price action shows a slow but steady upward movement inside a broader ascending structure.
This means:
- The market is forming higher lows over time
- Buyers are still active at lower levels
- Sellers are not strong enough to reverse the trend fully
- Price is moving inside a controlled upward channel
However, this is not a strong breakout phase yet. Instead, it is more like a gradual recovery where the market is building momentum step by step.
The current challenge for buyers is the $4,810 resistance zone. This level has repeatedly acted as a barrier, preventing further upside movement in early trading sessions.
Why $4,790 – $4,810 Zone Is Important
This price zone is currently the most important area on the chart.
Here is why:
- It acts as a short-term resistance zone
- It is also a liquidity area where both buyers and sellers are active
- Price has reacted multiple times around this level
- A breakout or rejection here will likely decide today’s direction
If price breaks above $4,810 with strong momentum, it may trigger new buying interest. On the other hand, if price fails to break this zone, we may see a pullback toward lower support levels.
Key Support and Resistance Levels
Understanding these levels is very important for intraday and swing traders.
🔴 Resistance Levels
$4,810 – $4,815
- Immediate resistance zone
- Price is currently struggling here
- Breakout needed for bullish continuation
$4,850
- Major resistance level
- Psychological zone
- Next upside target if momentum continues
🟢 Support Levels
$4,785
- Immediate support
- Current reaction zone for buyers
- First level where price may bounce
$4,772 – $4,760
- Strong support zone
- Lower boundary of the current structure
- Important area for trend continuation
If this zone breaks, the short-term bullish structure may weaken.
Market Behavior Right Now
The current market behavior shows consolidation rather than a strong trend.
In simple terms:
- Price is moving sideways
- Buyers and sellers are balanced
- No strong breakout yet
- Market is waiting for confirmation
This type of movement often happens before a bigger move. The longer price stays in a tight range, the stronger the eventual breakout can be.
Bullish Scenario (Buy Strategy)
The overall bias still slightly favors buyers as long as support levels remain intact.
Entry Idea for Buyers:
- Look for a dip toward $4,785
- Wait for rejection signals (bullish candles or wicks)
- Or wait for a breakout above $4,812
Possible Targets:
- First target: $4,830
- Final target: $4,850
Risk Management:
- Stop loss below $4,760
- Avoid entering without confirmation
The bullish idea works best if the market respects support and shows rejection from lower levels.
Bearish Scenario (Sell Strategy)
Selling Gold today is possible, but it should be treated as a short-term trade rather than a long-term trend reversal.
Entry Idea for Sellers:
- Wait for rejection near $4,810 – $4,815
- Look for bearish candlestick patterns like:
- Shooting star
- Bearish engulfing
Possible Targets:
- First target: $4,785
- Final target: $4,772
Risk Management:
- Stop loss above $4,825
- Keep trades short and controlled
This scenario becomes stronger if the price fails to break resistance multiple times.
Market Psychology Behind Today’s Movement
The current price action shows a clear balance between buyers and sellers.
- Buyers are defending lower support levels
- Sellers are defending upper resistance zones
- Neither side has full control yet
This is why the market is moving slowly. It is waiting for a trigger event such as a breakout, rejection, or volume spike.
In many cases, this type of structure leads to a strong breakout after consolidation ends.
What Traders Should Focus On Today
Instead of trying to predict the exact direction, traders should focus on reaction zones.
Key things to watch:
- Reaction at $4,785 support
- Break or rejection at $4,810 resistance
- Candle confirmation on the 4H chart
- Volume increase during breakout attempts
Patience is important in this type of market. Entering too early without confirmation can lead to unnecessary losses.
Bigger Picture Trend
Even though the short-term chart is showing consolidation, the broader structure is still relatively stable.
The market has not shown any strong bearish reversal signals on higher timeframes. Instead, it is still forming a controlled structure with gradual upward movement.
This means:
- Long-term trend is not broken
- Corrections are normal within the structure
- Market is still waiting for a strong catalyst
Final Summary
Gold (XAU/USD) is currently in a consolidation phase after recent volatility. The market is trading around $4,799 and is stuck between strong support and resistance levels. The most important zone today is $4,790 – $4,810. A breakout or rejection from this area will likely decide the next move.
If buyers manage to break above $4,810, the market may move toward $4,850. If sellers take control, price may drop toward $4,772 or lower support zones. Overall, today is a wait-and-watch session where patience and confirmation are more important than prediction.
Disclaimer: Trading forex and CFDs involves significant risk and may not be suitable for all investors. This article is for educational purposes only and should not be considered financial advice.
Written by Shah – Forex trader and market analyst at Forex News 360.