Will Bitcoin Break $80K? Full Scenario Analysis
Will Bitcoin Break $80K? The waiting game is officially over. Bitcoin has smashed through the heavy $75,500 resistance wall and is currently trading at $81,035. To casual observers, the breakout looks like a guaranteed ticket to $90,000. However, institutional order books and historical price data tell a much more sophisticated story.
Bitcoin has just arrived at a major technical crossroads. The decisions big funds make over the next few days will decide whether this rally continues to skyrocket or faces a sharp rejection.
Below is the deep-dive institutional breakdown of exactly what is happening on the daily chart right now.
The New Battlefield: Reclaiming the Lost Floor
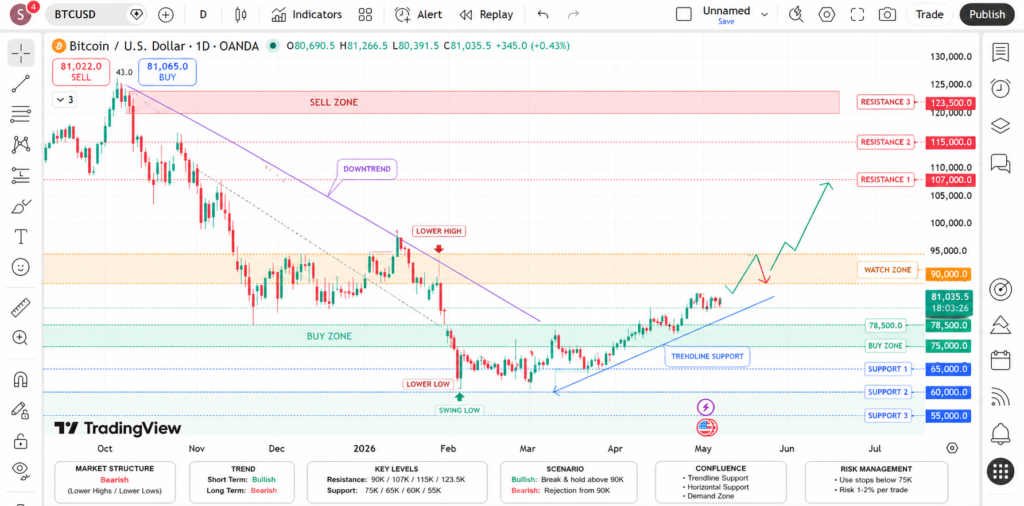
Looking closely at the daily chart, Bitcoin’s move to $81,000 isn’t just a random spike. It has brought the price directly up to a vital historical line in the sand.
Back in late January and early February 2026, this $81,000 zone acted as a strong “floor” (support) before the market took a sharp dive down to $60,000. In technical trading, an old floor often turns into a major ceiling (resistance) when the price tries to climb back up.
Bitcoin is currently testing this exact ceiling. Here are the two core scenarios for how this battle resolves.
Scenario 1: The Bull Continuation (Targeting $90,000)
Probability: 55%
If Bitcoin can hold its ground above $80,000 for a few more daily candle closes, it proves that buyers are comfortably absorbing all the selling pressure. This bullish continuation will be driven by two primary forces:
1. Market Structure Flip
When a major asset breaks above a multi-month downtrend and consolidates, it changes the market psychology. Short-term traders who were waiting to sell are forced to become buyers so they don’t get left behind. If $81,000 turns from a ceiling into a new floor, the path toward the next major psychological resistance at $88,000 to $90,000 becomes wide open.
2. Institutional Momentum and Spot ETF Inflows
The steady climb from the April lows near $65,000 up to $81,000 indicates consistent, quiet accumulation by large institutions rather than retail hype. As long as Bitcoin Spot ETFs show steady daily net inflows, the available supply on exchanges will continue to shrink, naturally driving the price higher.
Scenario 2: The “Fakeout” and Pullback (The $75,000 Re-test)
Probability: 45%
Markets rarely move upward in a straight line without checking their foundations. Because Bitcoin has rallied aggressively from its $65,000 bottom without any major pauses, a short-term cooldown is highly possible.
1. The Liquidity Hunt
Right now, millions of dollars in automated “buy stop” orders have been triggered by this breakout. Institutional players sometimes use this sudden burst of buying liquidity to sell large portions of their holdings at a premium, creating a brief “bull trap.”
2. Testing the Old Ceiling
If the bears push the price back below $80,000, expect a fast slide down to $75,000–$76,000. Do not panic if this happens. In professional trading, returning to test a previous major resistance level to make sure it holds as new support is incredibly healthy. As long as Bitcoin stays above $75,000 on a weekly basis, the broader uptrend is completely safe.
Real-Time BTC Price Target Matrix
| Market Scenario | Target Price | Probability | Key Technical Trigger to Watch |
| Bullish Acceleration | $88,500 | 55% | Clear daily close above $81,500 with rising volume |
| Healthy Consolidation | $79,500 | — | Sideways movement between $79k and $81k to build energy |
| Bearish Re-test | $75,200 | 45% | A daily close below $80,000, forcing a re-test of old resistance |
The Verdict: The Trend Is Your Friend
The daily chart shows a clean, beautiful series of “higher lows” and “higher highs” since the April bottom. This means the bulls are firmly in control of the trend.
While the battle at $81,000 will be incredibly volatile, the market structure remains heavily biased to the upside. The golden rule right now is simple: watch the daily closes. If Bitcoin stays above $80,000, the march toward all-time highs is officially back on track.
What’s Your Next Move?
Are you buying the breakout here, or are you waiting for a healthy dip back to $75,000 to catch the next wave? Let us know your strategy in the comments below!
Frequently Asked Questions (FAQ)
1. Why did Bitcoin struggle so much at $81,000 previously?
In early 2026, the $81,000 level was a major support zone where massive amounts of Bitcoin changed hands. When the price broke below it in February, many buyers were caught “underwater.” As the price returns to this level, those trapped buyers often sell just to break even, creating a temporary wall of supply.
2. Is it safe to buy Bitcoin right after a major breakout?
Buying right at a major historical resistance line carries higher short-term risk. Institutional traders often prefer to wait for either a confirmed daily close above the resistance line or a successful “back-test” where the price dips to test the old ceiling as new support before entering a position.
3. What happens if Bitcoin drops back below $80,000?
A drop below $80,000 doesn’t mean the rally is dead. It simply means the market needs to find a solid floor of buyers. The ultimate line in the sand is the $75,000–$76,000 zone. If that area holds during a dip, the overall macro structure remains entirely bullish.
Editorial Notes & Disclaimer
Written by Shah – Forex trader, technical market analyst, and lead editor at Forex News 360.
Risk Disclaimer: Trading spot gold, foreign exchange, and contracts for difference (CFDs) carries a high level of risk and may not be suitable for all investment profiles. All information published within this educational guide is intended solely for informational and research purposes and does not constitute personalized financial or investment advice.