USD/JPY Forex Analysis April 2026: Navigating the 160.00 Intervention Zone
USD/JPY Forex Analysis April 2026: The foreign exchange market in April 2026 has been characterized by one dominant theme: the relentless climb of the US Dollar against the Japanese Yen. As of April 17, 2026, the USD/JPY pair is trading in a highly volatile range, currently hovering near the 159.15 level. For traders following our USD/JPY Forex Analysis April 2026, this is a critical juncture where technical structures meet high-stakes geopolitical reality.
The “Ninja” (USD/JPY) is currently caught between a resilient US economy and a Japanese Yen weakened by shifting expectations from the Bank of Japan (BoJ). This deep dive explores the price action, technical barriers, and fundamental drivers defining this month’s trade.
1. Daily Price Action Recap: The “Climb and Compress”
The week of April 13–17, 2026, has provided a masterclass in market coiling. We have observed a “climb and compress” pattern as the pair nears a major long-term resistance zone.
| Date | Price Range | Market Sentiment |
| April 13–14 | 158.40 – 159.20 | Resistance Test: Bears attempted to defend the 160.00 psychological level. |
| April 15 | 158.70 – 159.80 | Range Expansion: Price spiked on news of US naval blockades in the Strait of Hormuz. |
| April 16 | 159.20 – 159.60 | Consolidation: The pair formed a tight triangle, signaling a buildup for the next move. |
| April 17 | 159.03 – 159.50 | Pivot Point: Trading near the 100-day EMA as traders eye the weekly close. |
2. Technical Analysis: The Key Battlegrounds
A vital part of any USD/JPY Forex Analysis April 2026 is identifying where the “Big Money” is likely to step in. While the higher timeframes show a clear ascending channel, short-term momentum is facing a heavy bearish divergence.
Resistance Levels (The Upside)
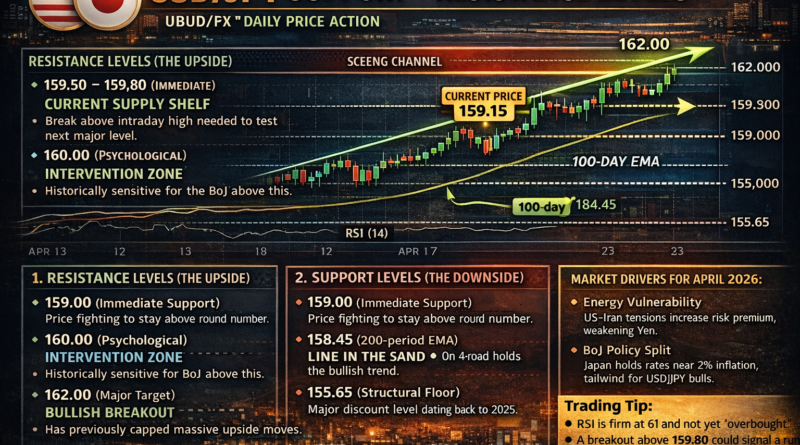
- 159.50 – 159.80 (Immediate): This is the current “supply shelf.” A decisive intraday break above this high is required before the pair can challenge the triple digits.
- 160.00 (The Intervention Red Zone): This is the most important psychological level in the market. Historically, the Bank of Japan and the Ministry of Finance have been extremely sensitive to prices above 160.00. Traders are currently “front-running” potential intervention, leading to choppy action here.
- 162.00 (Major Target): If the bullish triangle breaks upward and the BoJ remains silent, analysts see a clear path to 162.00.
Support Levels (The Downside)
- 159.00 (Psychological Floor): The price is currently fighting to stay above this round number.
- 158.45 (200-period EMA): On the 4-hour chart, the 200-EMA is the “line in the sand.” As long as the pair remains above this level, the bullish structure is technically intact.
- 155.65 (Structural Floor): This area aligns with a long-term trendline. A drop to this level would be viewed by many institutional buyers as a “value discount” for long-term positions.
3. Fundamental Drivers: Why is the Yen Weakening?
Technical levels only tell half the story. Our USD/JPY Forex Analysis April 2026 identifies three core fundamental “pillars” supporting the current uptrend.
Geopolitical Tension & Energy Vulnerability
Japan is uniquely vulnerable to energy shocks, importing the vast majority of its oil through the Strait of Hormuz. With current US-Iran tensions causing a “risk premium” in crude oil, the Japanese economy is under pressure. High energy costs act as a drag on the Yen, making it less attractive than the US Dollar, which benefits from the US being a net energy exporter.
The BoJ Policy Split
Inside the Bank of Japan, a clear divide has emerged. While Japan’s inflation is hovering near 2%, growth fears are preventing a hawkish shift. By keeping interest rates low while the rest of the world remains relatively high, the BoJ is inadvertently providing a “tailwind” for USD/JPY bulls.
US Interest Rate Narrative
While the Federal Reserve has paused its aggressive rate hikes, the “higher for longer” narrative remains. As long as US yields offer a significant premium over Japanese yields, capital will continue to flow out of the Yen and into the Dollar.
4. Trading Strategy: Indicators and Sentiment
The Relative Strength Index (RSI) is currently hovering around 61. In the context of a USD/JPY Forex Analysis April 2026, this is a bullish signal. It suggests firm buying pressure that has not yet reached “overbought” territory (above 70).
Trading Tip: Watch for a high-volume breakout above 159.80. If the market can clear this level without immediate BoJ intervention, a rapid run toward 162.00 becomes the high-probability scenario. Conversely, if we see a “fake-out” at 160.00 followed by a drop below 158.45, the bullish thesis will be invalidated for the short term.
Conclusion: A Month of Extreme Vigilance
April 2026 is proving to be a defining month for the Yen. Between the technical “coiling” on the charts and the geopolitical heat in the Middle East, the USD/JPY pair is poised for a major expansion. Traders must balance the technical bullishness against the very real risk of Japanese government intervention.
Stay disciplined, monitor the 160.00 level closely, and always use stop-losses in this high-volatility environment.
Disclaimer: Trading forex and CFDs involves significant risk and may not be suitable for all investors. This article is for educational purposes only and should not be considered financial advice.
Written by Shah – Forex trader and market analyst at Forex News 360.