USD/JPY Forecast: Rejection at 160 Signals Potential Drop Toward 158 | Bearish Bias Builds
USD/JPY Forecast: The USD/JPY pair is currently at an important decision point after a strong bullish trend that has now started to slow down. The market is showing early signs of exhaustion near a major psychological level, and price action has become less directional compared to earlier in the move.
In this analysis, we will break down the recent trend, current structure, key levels, and possible scenarios in simple and clear terms.
Market Context – What Just Happened
Earlier, USD/JPY was in a very strong bullish trend. Price moved cleanly from the 153 area with strong momentum. The structure was clear at that time — higher highs and higher lows with very little retracement. Buyers were fully in control, and every small pullback was quickly bought back up.
However, everything started to change when price approached the 160.00 region.
At that level, the behavior of the market shifted. Instead of continuing higher smoothly, price began to show repeated rejection. Each attempt to push above 160 was met with selling pressure, resulting in long wicks and unstable price movement.
Over the last few trading sessions, the chart has become less directional. Instead of a strong trend, we are now seeing choppy movement with sharp spikes in both directions. This is a sign that the market is no longer trending cleanly and is instead entering a consolidation or distribution phase near the highs.
Current Market Situation
At the moment, USD/JPY is trading around the 159.30 to 159.50 range. Price is sitting just below the 160 resistance zone and struggling to break higher with conviction.
Despite multiple attempts, buyers have not been able to generate strong follow-through above resistance. This shows that momentum is weakening at higher levels, and the market is becoming more balanced between buyers and sellers.
This type of behavior near major psychological levels often leads to either a breakout or a rejection move. The key question right now is whether buyers can regain control or whether sellers will continue to defend the 160 zone.
Key Levels to Watch
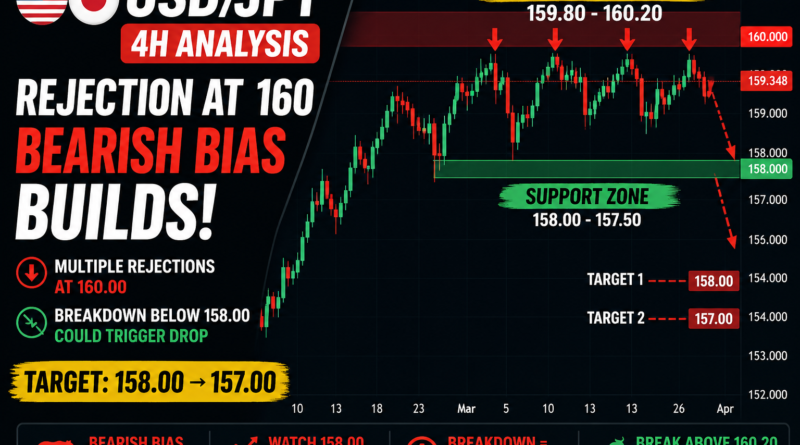
Resistance Zone: 159.80 – 160.20
The 160 level is extremely important in this pair. It is not only a psychological round number but also a zone where price has already been rejected multiple times.
Repeated failure to break above this area suggests that sellers are actively defending it. Until this level is broken with strong momentum, it will continue to act as a ceiling for price.
Support Zone: 158.00 – 157.50
On the downside, the 158.00 region is the first key support area. It has recently acted as a reaction level where buyers stepped in.
If price breaks below 158.00 with strength, it would be a sign that the short-term structure is weakening. In that case, further downside toward the 157.00 region could come into play.
Technical Structure and Interpretation
From a higher timeframe perspective, the overall trend is still technically bullish. The broader structure has not fully reversed yet. However, momentum is clearly fading.
The important change is in the way price is moving. Instead of strong impulsive continuation, we are now seeing compression under resistance. This often signals uncertainty in the market.
In trading terms, this kind of structure near highs usually leads to one of two outcomes:
- Accumulation before a breakout
- Distribution before a reversal or pullback
At this stage, the repeated failure at the 160 level slightly increases the probability of distribution rather than continuation.
Market Bias
The current bias is slightly bearish below the 160 level, but not aggressively so.
This is not a strong sell market yet, but it is also not a comfortable buy environment anymore. After multiple rejections at resistance, chasing long positions at this stage carries higher risk.
The better approach is to either look for short opportunities from resistance or wait for a clear breakdown before committing to directional trades.
Invalidation Scenario
The bearish view becomes invalid if price breaks and holds above 160.20 with strong momentum.
If that happens, it would signal that buyers have regained control, and the market could continue toward higher levels beyond 161.00.
In that case, the current rejection pattern would be considered a temporary consolidation before continuation, not a reversal.
Trade Scenarios
Scenario 1 – Rejection from Resistance (Preferred Setup)
If price pushes into the 159.80 – 160.00 zone again and shows rejection signals, a short setup becomes more attractive.
In this case, price could rotate back toward 158.50 and potentially retest the 158.00 support area.
This scenario aligns with the idea that the market is showing distribution at highs.
Scenario 2 – Breakdown Below Support
If price breaks below 158.00 with clear momentum and no immediate recovery, it would signal stronger bearish control.
In that case, continuation toward the 157.00 region becomes likely.
This would confirm that sellers are taking over the short-term structure.
Scenario 3 – Bullish Breakout (Alternative Scenario)
If price breaks above 160.20 with strong momentum and holds above it, the market structure shifts again.
In that case, the best approach would be to wait for pullbacks and look for continuation buys, as the trend would likely resume toward higher levels.
Why This Level Matters Today
The 160 level is not just a technical resistance zone — it is a major psychological barrier. Markets often react strongly around such levels, especially when they align with previous rejections.
Additionally, USD/JPY is sensitive to macro drivers such as US yields and USD strength. This means that when volatility returns, moves can be fast and decisive.
Because of this, the current range is unlikely to remain stable for long. A breakout or breakdown is expected rather than continued sideways movement.
Conclusion
USD/JPY is currently at a critical decision point after a strong bullish run. The market is no longer trending cleanly and is now showing signs of hesitation near resistance.
At this stage, buying aggressively near highs does not offer favorable risk-reward. The better approach is patience and confirmation.
The cleaner opportunities are either:
- Selling rejection moves from the 160 zone
- Or waiting for a confirmed breakdown below 158.00
Until one of these conditions is met, the market remains in a “wait and react” phase rather than a strong trending phase.
Disclaimer: Trading forex and CFDs involves significant risk and may not be suitable for all investors. This article is for educational purposes only and should not be considered financial advice.
Written by Shah – Forex trader and market analyst at Forex News 360.