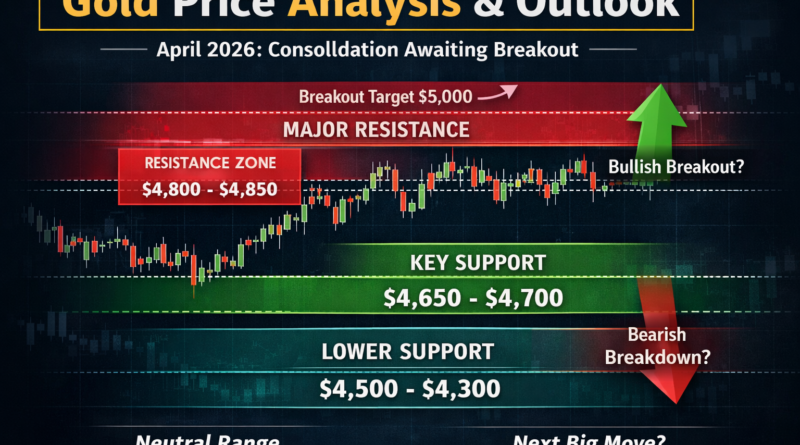
Gold Price Analysis Weekly Outlook (April 2026): Consolidation Before Next Big Move
This comprehensive gold weekly analysis April 2026 shows that the global precious metals market (XAU/USD) has officially entered a high-stakes consolidation phase. Following a volatile period that saw spot gold attempt a sharp recovery toward the $4,850 level, the market has settled into a tight, range-bound pattern. Traders around the globe are balancing a fine line between a long-term bullish continuation and a short-term bearish correction.
While the macro structure for bullion remains structurally strong, shorter-term momentum has flattened. Market participants are stepping to the sidelines, waiting for a definitive fundamental catalyst to spark the next major breakout.
Weekly Price Action Summary: A Shift to Range-Bound Action
Throughout the recent trading week, gold experienced a distinct transition from sharp, impulsive price swings to quiet, lateral consolidation.
- Early Week Momentum: Buyers initially tried to reclaim the broader multi-month bullish trend. This buying pressure pushed international spot gold up to challenge the immediate resistance zone sitting between $4,770 and $4,830 per ounce.
- Midweek Exhaustion: The upward momentum hit a technical wall. Spot prices repeatedly failed to secure a clean daily close above the $4,800–$4,850 price ceiling as selling pressure intensified near key historical supply zones.
- Late Week Pullback: The market experienced a modest pullback, dropping down to test short-term support lines near $4,710–$4,740. This quiet, sideways consolidation indicates a strong state of indecision among major institutional players.
This specific chart behavior is a classic example of post-rally digestion. After making large, aggressive moves earlier in the year, the market is catching its breath to accumulate fresh volume.
Key Technical Levels to Watch
Identifying clear boundaries on the chart is essential for managing risk. Based on current price action, these are the critical support and resistance levels defining the current structure:
The Resistance “Ceilings” (Upside Targets)
- $4,800 (Psychological Barrier): This remains the immediate hurdle that buyers must clear to restore short-term confidence.
- $4,850 – $4,870 (Major Supply Zone): This is the ultimate resistance wall. A verified break above this zone is required to prove that the broader bull run has resumed.
The Support “Floors” (Downside Safety Nets)
- $4,700 (Short-Term Base): This serves as an immediate structural safety net where dip-buyers have consistently stepped in.
- $4,650 (Major Macro Floor): This is a critical line in the sand. If gold fails to defend this price point, it could trigger a deeper correction across the commodities complex.
Under the Hood: Market Structure Analysis
From a structural perspective, gold is navigating a neutral trading range but maintains a long-term bullish bias.
A closer look at order flow reveals that while buyers are firmly in control of the multi-year macro trend, their immediate purchasing momentum has waned. Sellers are actively defending the overhead resistance zones, but they lack the aggregate volume needed to force a true market reversal. This creates a balanced, range-bound environment where the market alternates between short-term accumulation and profit-taking.
Technical Outlook: Two Major Scenarios
As we look at the upcoming trading weeks, the direction of the next macro move will rely on a clean breakout from the current $4,650 to $4,900 range.
1. The Bullish Continuation (Upside Breakout)
If global buyers manage to push spot gold past the heavy resistance at $4,870–$4,900, momentum will likely accelerate rapidly. A successful breakout would attract heavy institutional trend-followers, clearing a direct path to re-test the highly anticipated $5,000 psychological milestone, and potentially extending toward $5,300.
2. The Corrective Decline (Downside Breakdown)
Conversely, if gold repeatedly fails to breach its overhead targets and slips below the crucial $4,650 support base, the short-term sentiment will pivot to bearish. This breakdown would open the door for a deeper corrective phase, potentially dragging spot prices down to test macro targets at $4,500 and $4,400.
2026 Gold Price Target Reference Table
To give you a clearer view of the market, here is a breakdown of potential spot targets alongside domestic retail prices in India (where 24K gold is currently balancing near ₹1.54 Lakh per 10 grams):
| Market Scenario | Spot Gold Target (XAU/USD) | Domestic Indian Price (24K/10g) | Primary Macro Catalyst |
| Bullish Breakout | $5,150 – $5,300 | ₹1,65,000+ | Complete failure of US-Iran talks / Aggressive Fed rate cuts |
| Base Case (Range) | $4,700 – $4,850 | ₹1,54,040 | Steady central bank buying / Range-bound Dollar Index |
| Bearish Correction | $4,400 – $4,500 | ₹1,44,000 | Rising US Treasury yields / Stronger-than-expected economic data |
Key Fundamental Triggers to Watch This Week
Technical charts never move in a vacuum. To anticipate the next big directional breakout, keep a close eye on these three market forces:
- The US Dollar and Bond Yields: Gold shares a historical inverse relationship with the US Dollar. Any unexpected hawkish commentary from Federal Reserve officials or hot inflation data will push treasury yields higher, putting immediate downward pressure on non-yielding bullion.
- Geopolitical Volatility: Recent headlines showing that the highly anticipated US-Iran peace talks have faced structural roadblocks keep the global “fear premium” alive. Any sudden flare-up in shipping bottlenecks near the Strait of Hormuz will rapidly accelerate safe-haven inflows into gold.
- Sovereign Central Bank Hoarding: Institutional demand remains an incredibly supportive factor. Global central banks have maintained net-buyer status for 17 consecutive months, establishing a highly resilient structural floor under global prices.
Conclusion and Final Verdict
To summarize this gold weekly analysis April 2026, the market is building up massive latent pressure inside a textbook consolidation zone. While the long-term trend remains fundamentally bullish, the short-term outlook is strictly neutral.
For strategic savers and disciplined traders alike, the smartest approach is to avoid over-leveraging in the middle of a choppy range. Instead, keep a close watch on the $4,650 floor and the $4,850 ceiling. The side that breaks first will dictate the trajectory of gold for the rest of the quarter.
Disclaimer: Trading forex and CFDs involves significant risk and may not be suitable for all investors. This article is for educational purposes only and should not be considered financial advice.
Written by Shah – Forex trader and market analyst at Forex News 360.