XAUUSD (Gold) Analysis Guide: Understanding Market Structure, Key Levels, and Price Behavior
Gold (XAUUSD) is one of the most actively traded instruments in the global financial market. Its price is influenced by multiple factors, including US dollar strength, interest rates, inflation expectations, and overall global risk sentiment.
Instead of focusing on short-term predictions, it is more useful to understand how gold behaves around key technical levels. This helps traders and investors make more informed decisions based on structure rather than emotion.
This article explains the current market behavior of gold in a simple, educational way and highlights how traders typically analyze similar conditions.
Market Behavior Overview
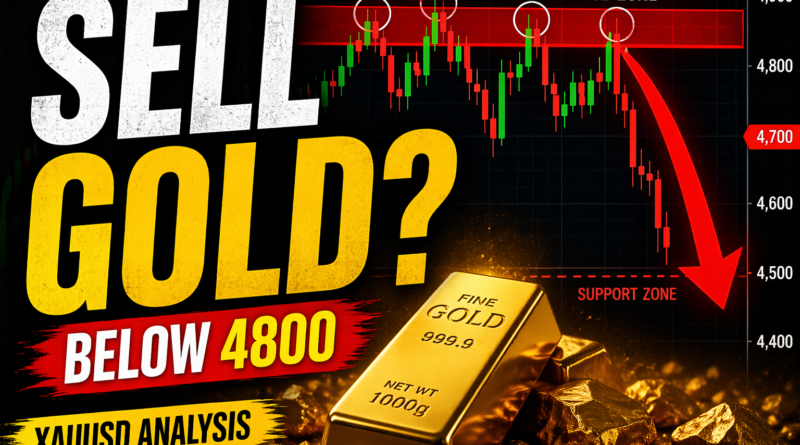
Recently, gold has been moving in a wide and volatile range. Price action shows repeated attempts to move higher, followed by strong reactions near resistance areas.
In such conditions, the market is generally described as:
- Range-bound (sideways)
- Volatility-driven
- Reaction-based rather than trending
When price repeatedly fails to sustain new highs, it often indicates that sellers are active at higher levels, while buyers are still attempting to maintain support zones.
This type of environment is common when markets are waiting for major economic data or macroeconomic clarity.
Understanding Key Technical Zones
Instead of viewing levels as “buy or sell signals,” it is better to understand them as areas of interest where market reactions often occur.
Resistance Zones (Supply Areas)
Resistance zones are price regions where selling pressure tends to increase.
In gold, higher levels often act as resistance because:
- Traders take profits after rallies
- Institutions may reduce exposure
- New sellers enter the market
When price approaches resistance, it is common to see:
- Slower momentum
- Consolidation
- Rejection wicks or pullbacks
Support Zones (Demand Areas)
Support zones are areas where buying interest tends to appear.
These levels form because:
- Buyers see value at lower prices
- Short positions are closed
- Long-term investors accumulate positions
When price reaches support, market behavior may include:
- Temporary rebounds
- Consolidation phases
- Increased volatility
Market Structure Explanation
Market structure refers to the overall pattern of highs and lows.
There are three common structures:
1. Uptrend Structure
- Higher highs
- Higher lows
- Buyers in control
2. Downtrend Structure
- Lower highs
- Lower lows
- Sellers in control
3. Range Structure (Current Phase)
- No clear direction
- Price moves between support and resistance
- Both buyers and sellers active
Gold often shifts between these phases depending on macroeconomic conditions.
Why Gold Becomes Volatile
Gold is strongly influenced by global economic and political factors. Some of the key drivers include:
- US Dollar strength or weakness
- Interest rate expectations
- Inflation data
- Geopolitical uncertainty
- Central bank demand
When these factors conflict, gold often enters consolidation phases, where price moves sideways with sharp swings in both directions.
How Traders Typically Analyze This Market
Instead of predicting exact price movements, many traders focus on:
1. Reaction Zones
Observing how price behaves around support and resistance.
2. Confirmation Signals
Waiting for confirmation such as:
- Break and hold above resistance
- Break and hold below support
3. Momentum Analysis
Checking whether moves are strong or weak:
- Strong momentum = trend continuation
- Weak momentum = possible reversal or range
4. Risk Management
Professional trading always includes:
- Defined stop-loss levels
- Controlled position sizing
- Avoiding emotional decisions
Scenario-Based Market Understanding
Rather than forecasting, traders often consider possible scenarios:
Scenario 1: Range Continuation
If price remains between support and resistance, the market may continue to move sideways with volatility.
Scenario 2: Breakout Above Resistance
If price breaks and holds above a major resistance zone, it may indicate a shift toward bullish momentum.
Scenario 3: Breakdown Below Support
If price breaks below key support, it may indicate increased bearish pressure and potential continuation lower.
Each scenario depends on confirmation, not prediction.
Importance of Patience in Gold Trading
Gold does not always trend clearly. In many cases, it moves in unpredictable phases before establishing direction.
This is why experienced traders:
- Wait for confirmation
- Avoid overtrading
- Focus on high-quality setups
- Prioritize risk management over prediction
Patience often plays a bigger role than market timing.
Conclusion
Gold (XAUUSD) is currently in a phase where price reacts strongly to technical zones and macroeconomic developments. Rather than focusing on short-term forecasts, it is more effective to understand structure, key levels, and market behavior.
Key takeaways:
- Gold moves between support and resistance during uncertain phases
- Market structure is more important than predictions
- Confirmation is required before making trading decisions
- Risk management is essential in all conditions
By focusing on structure and discipline, traders can improve consistency and avoid emotional decision-making in volatile markets.
Disclaimer
This article is for educational and informational purposes only. It does not provide financial advice or trading recommendations. Trading financial markets involves risk, and you should always conduct your own research and apply proper risk management before making any trading decisions.
Disclaimer: Trading forex and CFDs involves significant risk and may not be suitable for all investors. This article is for educational purposes only and should not be considered financial advice.
Written by Shah – Forex trader and market analyst at Forex News 360.
Pingback: XAUUSD Forecast Today: Gold Turns Bearish Below 4800 as Dollar Strength Builds