Internal vs External Liquidity Explained (With Real Trading Examples)
If you’ve spent any time watching price charts, you’ve probably noticed something that feels “unfair.”
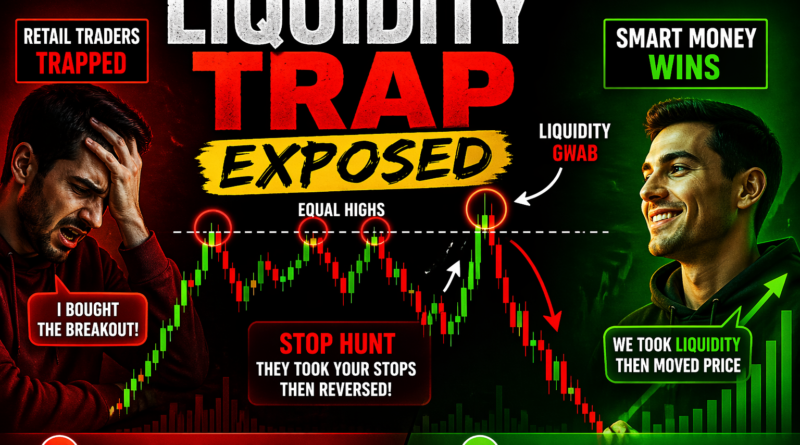
Price breaks a clear high… traders buy the breakout… and then price suddenly reverses and hits their stop loss.
It feels random at first. But it’s not random at all.
What you’re actually seeing is liquidity being taken.
Once you understand internal vs external liquidity, the market starts to make a lot more sense. You stop seeing “confusing reversals” and start seeing structured moves driven by where orders are sitting.
This concept is widely used in Smart Money Concepts (SMC), but we’ll keep it simple, practical, and focused on how price actually behaves on a chart.
What is Liquidity in Trading?
In simple terms:
Liquidity = orders in the market.
These orders mainly come from:
- Stop losses
- Pending buy/sell orders
- Breakout traders entering positions
- Institutional order execution needs
Big players in the market (banks, funds, institutions) don’t just “enter trades instantly.” They need volume. And that volume is created when retail traders place stops and breakout orders.
So price often moves in a way that collects liquidity first, then continues in the real direction.
External Liquidity (The Obvious One)
External liquidity is the easiest type to identify on your chart.
It sits outside the current price structure.
Common examples:
- Previous day high (PDH)
- Previous day low (PDL)
- Swing highs
- Swing lows
- Equal highs
- Equal lows
These are levels that most traders can clearly see.
And that’s exactly why they matter. Moving Averages (EMA vs SMA): Complete Beginner Guide for Forex, Gold & Crypto Traders
Real Market Example
Imagine the market is moving sideways and forms equal highs.
Most retail traders think: “If price breaks this level, I’ll buy the breakout.”
What’s actually sitting above those highs?
A pool of:
- Buy stop orders (breakout traders)
- Stop losses of short sellers
So when price reaches that level:
- It spikes above the highs
- Triggers buy stops
- Takes out short stop losses
- Provides liquidity for large sell orders
Then what happens next?
Price often drops sharply after the sweep.
That move is called a liquidity grab of external liquidity.
Internal Liquidity (The Hidden One)
Internal liquidity is where most traders get lost.
It is inside the current structure, not outside it.
It is less obvious, but extremely important.
Internal liquidity includes:
- Minor highs and lows inside a range
- Small pullbacks in a trend
- Consolidation zones
- Intraday swing points
- Inefficiencies or imbalance areas
Think of it as “liquidity inside the move,” not at the edges.
Why Internal Liquidity Matters
Before price can reach major external targets, it often needs to:
- Clean up internal orders
- Grab weak positions
- Create space for expansion
This is where price “builds energy” before the real move. RSI Indicator Explained | Overbought & Oversold Strategy for Trading
How Price Actually Moves (The Real Logic)
Price does not move randomly from point A to point B.
It usually follows a structured sequence like this:
1. Internal liquidity is taken first
Price sweeps minor highs/lows inside the range.
2. Market structure shifts or consolidates
This is where momentum is built.
3. External liquidity becomes the target
Price expands toward obvious highs or lows.
Clean Example (Bullish Scenario)
Let’s say the market is trending upward overall.
- Price pulls back into a range
- It takes out internal lows (stop hunt inside structure)
- It shows a strong bullish reaction
- Then it pushes upward
- Finally, it breaks previous highs (external liquidity)
What most traders see: “Nice breakout, I’ll buy here.”
What actually happened:
- Internal liquidity was cleared first
- Then expansion was engineered
- External liquidity was the final target
If you only focus on breakouts, you often enter too late.
If you understand internal liquidity, you can anticipate the move earlier.
Why Most Traders Get Trapped
Most retail traders behave in a predictable way:
- They buy breakouts above resistance
- They sell breakdowns below support
- They place stop losses at obvious highs/lows
Now think about that.
Those exact areas are:
- External liquidity zones
- Institutional target areas
- Stop hunt zones
So what typically happens?
- Price moves into those zones
- Retail traders enter
- Stops get triggered
- Smart money fills positions
- Price reverses
It’s not manipulation in a conspiracy sense. It’s simply how liquidity-based execution works. XAUUSD Trading Guide: Price Action, RSI, EMA, FED, CPI & Risk Management
How to Use This in Your Trading
You don’t need complex tools to apply this. You just need to change how you read structure.
1. Stop chasing obvious breakouts
If a level is too clean and obvious, it is often liquidity, not opportunity.
Ask yourself:
- Who is buying here?
- Where are their stops?
If it’s obvious to you, it’s obvious to the market.
2. Watch internal structure first
Before any major move, look for:
- Small liquidity sweeps inside the range
- False breaks within consolidation
- Quick stop hunts on lower timeframes
These often happen before expansion.
3. Align with higher timeframe bias
Internal liquidity becomes powerful only when it aligns with the broader direction.
For example:
- Higher timeframe bullish trend
- Internal liquidity taken on lower timeframe
- Then continuation upward
This alignment improves probability.
4. Look for displacement after liquidity grab
One of the strongest signals is:
Liquidity sweep → strong impulsive move
That displacement tells you:
- Orders have been filled
- Direction is chosen
- Expansion is likely underway
Quick Summary
Let’s simplify it:
External Liquidity
- Obvious highs and lows
- Previous day levels
- Equal highs/lows
- Main targets of price
Internal Liquidity
- Minor structure inside ranges
- Pullbacks and intrarange highs/lows
- Fuel used before expansion
Core idea:
Internal liquidity builds the move.
External liquidity completes the move. Break of Structure vs Change of Character (BOS vs CHoCH) – Smart Money Concepts Guide
Final Thoughts
Once you understand internal vs external liquidity, trading stops feeling random.
You no longer ask: “Why did price reverse there?”
Instead, you start asking: “Whose liquidity was taken before that move?”
That shift changes how you see every chart.
You stop reacting to candles and start reading intention behind movement.
And that is where consistency starts to develop, not from indicators or setups, but from understanding how price seeks liquidity.
If you’re serious about building a deeper understanding of market structure, liquidity, and price action behavior, continue studying how these concepts interact across different timeframes.
Disclaimer
Disclaimer: Trading forex and CFDs involves significant risk and may not be suitable for all investors. This article is for educational purposes only and should not be considered financial advice.
Written by Shah – Forex trader and market analyst at Forex News 360.
This is best for new traders :
Pingback: 90% of Traders Fail Because of This One Prop Firm Rule (Risk Management Explained Simply)
Pingback: Liquidity Grab vs Liquidity Sweep: Key Differences Every Trader Must Know