Gold Market Strategy: Key Support & Resistance Levels for April 21, 2026
Gold Market Strategy is currently showing a short-term recovery move after holding strong support around the $4,735 area. This bounce looks like a relief rally rather than a full trend reversal, as the broader market is still uncertain.
At the moment, sentiment is mixed. On one side, ongoing geopolitical tensions in the Middle East are supporting gold as a safe-haven asset. On the other side, a stronger US Dollar is limiting how far gold can rise. Because of this balance between opposing forces, price is moving in a controlled range instead of trending strongly in one direction.
Today can be described as the “calm before the storm.” The market is waiting for major US economic data, including Retail Sales and employment-related figures. These events are expected to bring volatility and could decide whether gold breaks higher or drops back into its lower range.
Key Levels to Watch
The chart is clearly forming a battle zone between buyers and sellers. These levels are important for intraday trading decisions.
Major Resistance: $4,848 – $4,860
This is a strong supply area. Sellers have been active here multiple times. Unless there is very strong bullish news, price may struggle to break this zone. A clean break and close above it would signal bullish continuation.
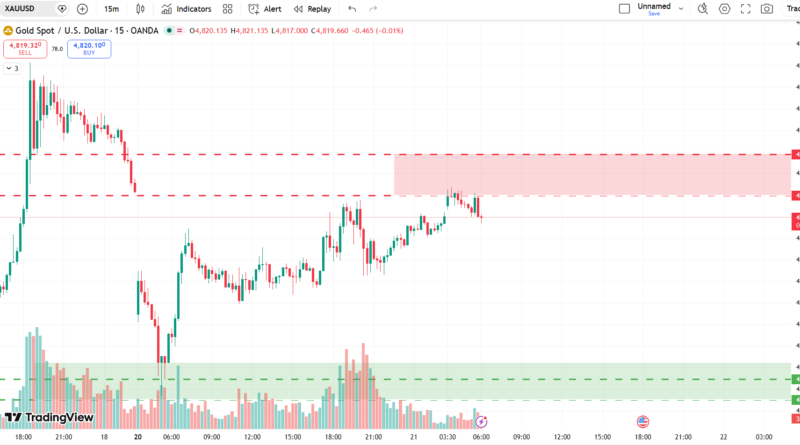
Immediate Pivot Zone: $4,820 – $4,830
This is the decision area. Price is constantly reacting around this level. Staying above this zone keeps short-term momentum slightly bullish, while losing it may shift control back to sellers.
Strong Support Zone: $4,735 – $4,744
This is the key demand area. Buyers have defended this level strongly. If price returns here, traders will be watching for potential buy opportunities. A breakdown below this level could open the door toward $4,700 and lower.
Technical Market Structure
From a technical point of view, gold is still in a consolidation phase with a slight upward bias.
One important observation is repeated rejection near the $4,830–$4,848 region. Multiple candles show long upper wicks, which indicates that sellers are actively defending this resistance zone. This is a sign that supply is strong at higher levels.
At the same time, the market is not collapsing. Instead, it is forming higher lows after bouncing from $4,735. This suggests that buyers are gradually stepping in, but they are not yet strong enough to break resistance.
Another key factor is volume behavior. Recent price movement shows declining volume as price moves upward. This often suggests weakening momentum. In simple terms, the move may be a correction rather than a strong trend continuation unless volume increases during a breakout.
What Traders Should Watch
1. US Economic Data Impact
Upcoming US Retail Sales and ADP Employment data can significantly increase volatility. Strong US data usually supports the US Dollar, which can pressure gold downward. Weak data may support gold and push it higher.
2. Geopolitical Headlines
Any escalation or breakdown in geopolitical tensions can trigger sudden spikes in gold prices. In such cases, gold can quickly move toward higher resistance zones like $4,880–$4,900.
3. 4H Candle Confirmation
A key confirmation for bullish continuation is a 4-hour candle closing above $4,850. Without this confirmation, upward moves remain vulnerable to rejection and fake breakouts.
Trading Scenarios
Bullish Scenario (Buy Setup)
- Entry: Break and hold above $4,830
- Target 1: $4,848
- Target 2: $4,870
- Invalidation: Below $4,815
This setup becomes valid only if momentum continues with strong volume and no immediate rejection at resistance.
Bearish Scenario (Sell Setup)
- Entry: Rejection at resistance or break below $4,815
- Target 1: $4,790
- Target 2: $4,745
- Invalidation: Above $4,860
This scenario plays out if sellers defend resistance and push price back into the lower range.
Simple Market Outlook
Overall, the short-term outlook is neutral to slightly bullish. Gold is still trading inside a range, and price is waiting for a strong catalyst from upcoming economic data.
In the current environment, the most likely behavior is continued movement between $4,790 and $4,850 until a breakout occurs. If resistance fails to break, price may revisit support before the next major move.
Educational Insight
During high-impact news periods, technical levels often act like elastic zones. Price may stretch beyond them temporarily due to volatility, but it often returns to equilibrium unless the news fundamentally changes market expectations.
This is why traders should reduce risk, avoid over-leveraging, and wait for confirmation instead of predicting direction too early.
Bonus Observation
The US Dollar Index (DXY) remains a key factor. If the dollar strengthens during news releases, gold is more likely to reject resistance zones. If the dollar weakens, gold has a higher chance of breaking above $4,850 and continuing higher.