XAUUSD Gold Analysis : Bullish Trend vs Bearish Pressure – Key Levels & Buy/Sell Strategy
Bullish Trend vs Bearish Pressure: Gold (XAU/USD) is currently moving inside a mixed market condition where both buyers and sellers are active. The overall long-term trend still looks bullish, but in the short term, the market is showing signs of pressure and correction.
After a strong upward rally, price recently faced rejection near the $4,890 area. Since then, Gold has entered a cooling phase where traders are taking profits and waiting for the next clear direction.
This type of movement is very normal in strong trends. Markets do not move in a straight line. They move in waves, uptrend, pullback, consolidation, and then continuation.
Right now, Gold is in the “pullback phase” inside a larger bullish structure.
What Is Happening in the Market?
At the moment, two main forces are affecting Gold:
1. Safe-Haven Demand (Bullish Support)
Global uncertainty and geopolitical tensions are keeping demand for Gold strong. When uncertainty rises, investors often move money into Gold because it is considered a safe asset.
This is helping prevent a strong downside move.
2. Dollar Strength (Bearish Pressure)
At the same time, a stronger U.S. Dollar and rising bond yields are putting pressure on Gold. Since Gold is priced in USD, a strong dollar often makes Gold weaker in the short term.
This is why price is not continuing higher smoothly.
Current Market Structure
Gold is currently balancing between buyers and sellers.
- Buyers are defending lower support zones
- Sellers are active near resistance levels
- Price is moving in a correction phase
- No clear breakout direction yet
This means the market is waiting for a strong trigger before making the next big move.
Key Levels to Watch
These levels are important for understanding where price may react.
🔴 Resistance Levels
$4,830 – $4,850
- Strong selling zone
- Price has struggled here multiple times
- Break above this level is needed for bullish continuation
$4,890 – $4,900
- Major resistance area
- Previous high where strong selling appeared
- Long-term breakout zone
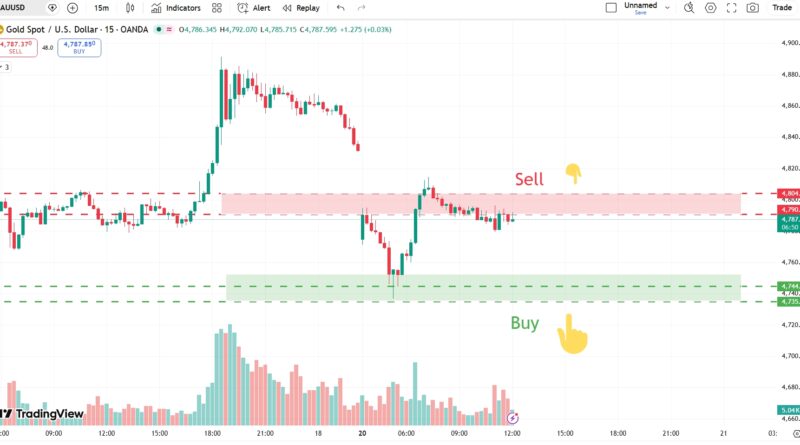
🟢 Support Levels
$4,780 – $4,795
- Immediate support zone
- Current decision area
- If price holds here, buyers may step in again
$4,760 – $4,770
- Strong demand zone
- Important “buy the dip” area
- If this breaks, deeper correction may follow
Technical View (Simple Explanation)
Looking at the chart structure, we can see a few important signs:
1. Moving Averages
Short-term moving averages on lower timeframes are flattening or slightly turning down. This shows that bullish momentum is slowing in the short term.
2. Candlestick Rejections
On recent candles, we can see long upper wicks. This means that whenever price tries to go higher, sellers push it back down.
This is a sign of resistance pressure.
3. Volume Activity
There is increased selling volume during red candles. This suggests that some traders are taking profits after the strong rally.
However, this does not confirm a full reversal. It only shows short-term pressure.
Market Psychology
The market is currently in a “decision zone.”
- Buyers believe the uptrend is not finished
- Sellers believe price is overextended short term
- Both sides are waiting for confirmation
This is why price is moving slowly and sideways.
Trading Strategy (Simple and Safe Approach)
In this type of market, patience is more important than prediction. The best strategy is to wait for confirmation instead of chasing price.
🟢 Bullish Scenario (Buy on Dip)
The bullish trend is still valid as long as support holds.
Possible Buy Setup:
- Wait for price to drop toward $4,765 – $4,780
- Look for rejection signals (bullish candles or strong bounce)
Targets:
- First target: $4,830
- Second target: $4,850
Risk Management:
- Stop loss below $4,760
- Do not buy in the middle of the range
🔴 Bearish Scenario (Short-Term Sell)
Selling is possible, but only as a short-term trade.
Possible Sell Setup:
- Price fails to break $4,830 multiple times
- Bearish candlestick confirmation appears
Targets:
- First target: $4,785
- Second target: $4,770
Risk Management:
- Stop loss above $4,855
- Avoid holding trades too long
What Traders Should Focus On
Instead of trying to predict every move, focus on key reactions:
- Reaction at $4,780 support
- Reaction at $4,830 resistance
- Breakout or rejection confirmation
- Candle structure on 1H and 4H charts
The market will clearly show direction once one of these levels breaks.
Bigger Picture (Important)
Even though short-term pressure is visible, the overall trend is still considered bullish.
This means:
- The correction is normal after a strong rally
- Buyers are still active at lower levels
- Trend is not reversed yet
- Market is still in a long-term upward structure
Only a strong break below $4,760 would start changing this bigger picture.
Simple Conclusion
Gold is currently in a correction phase inside a broader bullish trend.
- Short-term: Slightly bearish / sideways
- Long-term: Still bullish
- Key zone: $4,780 – $4,850
The best approach today is to wait for confirmation instead of forcing trades.
- Buy only near support with confirmation
- Sell only near resistance with rejection signals
- Avoid trading in the middle zone
Patience and discipline are more important than prediction in this type of market.
Disclaimer: Trading forex and CFDs involves significant risk and may not be suitable for all investors. This article is for educational purposes only and should not be considered financial advice.
Written by Shah – Forex trader and market analyst at Forex News 360.