Candlestick Patterns – How to Read Candlestick Charts for Beginners
Candlestick patterns : Trading in the forex market can feel confusing when you first open a chart. The candles move quickly, prices rise and fall every second, and many beginners have no idea what the market is actually trying to show.
This is where candlestick charts become important.
Candlestick patterns help traders understand price movement, market psychology, and buying or selling pressure. They are one of the most widely used tools in forex trading because they make charts easier to read compared to simple line charts.
Whether you trade forex, gold, stocks, or crypto, understanding candlestick charts is an important skill for beginners.
In this guide, you will learn:
- What candlestick charts are
- How candlestick patterns work
- The meaning of bullish and bearish candles
- Popular candlestick patterns used in forex trading
- Real trading examples
- Common mistakes beginners make
- Risk management tips
- Frequently asked questions
This article is written in simple English for beginners who want to improve their understanding of price action trading. How to Draw Fibonacci Retracement Levels: Step-by-Step Trading Guide for Beginners
Important Financial Disclaimer
Forex trading and margin trading involve a high level of risk and may not be suitable for all investors. The information in this article is for educational purposes only and should not be considered financial advice or investment advice.
Market conditions can change quickly, and no candlestick pattern guarantees profits. Always do your own research and consider speaking with a licensed financial professional before making trading decisions.
What Are Candlestick Charts?
Candlestick charts are a visual way to show price movement in financial markets such as:
- Forex
- Stocks
- Gold
- Crypto
- Commodities
Each candlestick represents price activity during a specific period of time.
A candle can represent:
- 1 minute
- 5 minutes
- 1 hour
- 4 hours
- 1 day
- 1 week
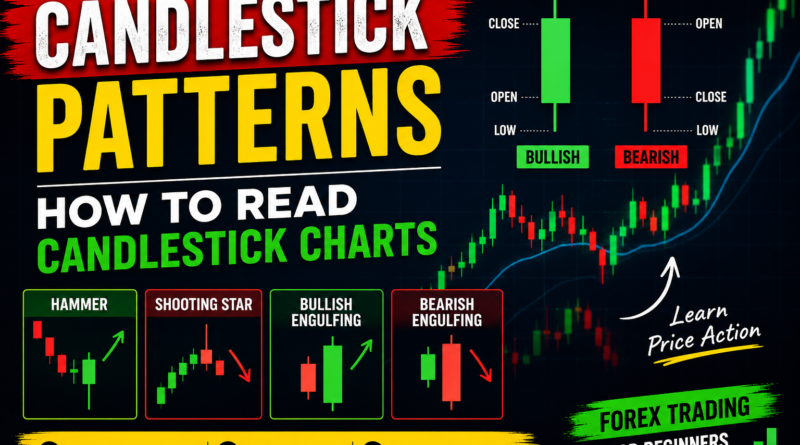
Every candlestick shows four important price levels:
- Opening price
- Closing price
- Highest price
- Lowest price
Candlestick charts were originally developed in Japan hundreds of years ago and are now used by traders around the world. What Is Support and Resistance? Beginner Trading Guide (Easy Explanation)
Why Candlestick Charts Matter in Forex Trading
Candlestick charts help traders understand:
- Market direction
- Buyer and seller strength
- Trend momentum
- Potential reversals
- Entry and exit opportunities
Unlike basic line charts, candlesticks show more information about market behavior.
This is why candlestick analysis is considered one of the foundations of technical analysis.
How to Read a Candlestick
A candlestick has two main parts:
- The body
- The wick (shadow)
The Body
The body shows the opening and closing prices.
Bullish Candle
A bullish candle forms when the closing price is higher than the opening price.
These candles are usually green or white.
This means buyers controlled the market during that time period.
Bearish Candle
A bearish candle forms when the closing price is lower than the opening price.
These candles are usually red or black.
This means sellers were stronger.
Understanding the Wick
The wick shows the highest and lowest prices reached during the selected timeframe.
- Upper wick = highest price
- Lower wick = lowest price
Long wicks often show rejection from certain price levels.
For example:
- A long upper wick may show sellers pushed the market down from higher prices.
- A long lower wick may show buyers defended lower prices.
Example of a Bullish Candle
Imagine EUR/USD opens at 1.1000 and closes at 1.1060.
During that session:
- The highest price reached was 1.1080
- The lowest price reached was 1.0980
Because the market closed higher than it opened, the candle becomes bullish.
This suggests buyers had stronger momentum.
Example of a Bearish Candle
Now imagine GBP/USD opens at 1.2500 and closes at 1.2440.
During that period:
- The highest price was 1.2520
- The lowest price was 1.2420
This creates a bearish candle because sellers pushed the price lower before the candle closed. Moving Averages (EMA vs SMA): Complete Beginner Guide for Forex, Gold & Crypto Traders
Most Popular Candlestick Patterns
Learning a few important candlestick patterns is usually better than trying to memorize dozens at once.
Below are some of the most commonly used patterns in forex trading.
1. Doji Pattern
A Doji forms when the opening and closing prices are nearly the same.
This shows market indecision.
Neither buyers nor sellers are fully in control.
What It Means
A Doji often appears before a trend reversal or during market uncertainty.
Example
If gold rises strongly and then a Doji appears near resistance, traders may see it as a warning that buying momentum is weakening.
2. Hammer Pattern
The Hammer is a bullish reversal pattern.
It usually forms after a downtrend.
Structure
- Small candle body
- Long lower wick
- Small or no upper wick
What It Means
Sellers pushed prices lower, but buyers returned and pushed the market back up before the candle closed.
This may signal buying pressure.
Real Example
Suppose EUR/USD drops for several hours and then forms a Hammer near a strong support zone.
Many traders may view this as a possible reversal signal.
However, professional traders often wait for confirmation from the next candle before entering a trade.
3. Shooting Star Pattern
The Shooting Star is a bearish reversal pattern.
It usually appears after an uptrend.
Structure
- Small body
- Long upper wick
- Small lower wick
What It Means
Buyers pushed the market higher, but sellers regained control and forced prices back down. This may signal weakness in the uptrend.
4. Bullish Engulfing Pattern
This is one of the strongest bullish candlestick patterns.
It happens when:
- A small bearish candle forms first
- A larger bullish candle completely covers the previous candle
What It Means
Buyers suddenly become stronger than sellers. This can indicate a possible upward reversal.
5. Bearish Engulfing Pattern
This is the opposite of the bullish engulfing pattern.
It forms when:
- A small bullish candle appears first
- A larger bearish candle fully covers it
What It Means
Selling pressure is increasing. The market may start moving lower.
6. Morning Star Pattern
The Morning Star is a bullish reversal pattern made of three candles.
Structure
- Large bearish candle
- Small indecision candle
- Strong bullish candle
What It Means
The market may be changing from bearish to bullish sentiment.
7. Evening Star Pattern
The Evening Star is the bearish version of the Morning Star.
Structure
- Strong bullish candle
- Small indecision candle
- Large bearish candle
This pattern can signal a possible downward reversal.
Checkout: XAUUSD Trading Guide: Price Action, RSI, EMA, FED, CPI & Risk Management
How Professional Traders Use Candlestick Patterns
Professional traders usually do not rely on candlestick patterns alone.
Instead, they combine them with:
- Support and resistance
- Trend analysis
- Volume analysis
- RSI indicator
- Moving averages
- Market structure
For example:
A Hammer pattern near strong support is usually more meaningful than a Hammer appearing randomly in the middle of a chart.
Context matters in trading. Smart Money Concepts (SMC) Explained: Order Blocks, Liquidity & Strategy
Risk Management Is More Important Than Patterns
One of the biggest mistakes beginners make is believing candlestick patterns guarantee profits.
They do not.
Even strong patterns can fail because financial markets are unpredictable.
Experienced traders focus heavily on:
- Stop loss placement
- Position sizing
- Risk-to-reward ratio
- Emotional discipline
Many successful traders risk only a small percentage of their trading account on each trade.
Proper risk management is essential for long-term survival in forex trading.
Common Candlestick Trading Mistakes
1. Trading Without Confirmation
Beginners often enter trades too early.
Professional traders usually wait for additional confirmation before entering a position.
2. Ignoring the Bigger Trend
A bullish pattern inside a strong downtrend may fail.
Always check the overall market direction first.
3. Overtrading
Many beginners take too many trades after learning a few patterns.
Quality setups are more important than quantity.
4. Using Very Small Timeframes
Lower timeframes contain more market noise and fake signals.
Many beginners perform better using:
- 1-hour charts
- 4-hour charts
- Daily charts
5. No Stop Loss
Trading without a stop loss can lead to large losses.
Risk management should always come before profit targets. Forex Trading for Beginners: Complete Guide to Pips, Leverage, Risk Management, and Trading Psychology
Simple Candlestick Trading Example
Imagine GBP/USD is falling toward a major support level.
Then:
- A Hammer candle forms
- RSI shows oversold conditions
- The next candle closes bullish
Some traders may see this as a potential buying opportunity because:
- Buyers defended support
- Selling pressure weakened
- Confirmation appeared
However, no trade setup is guaranteed to work.
This is why traders must manage risk carefully.
Are Candlestick Patterns Accurate?
Candlestick patterns can be useful tools for understanding price action, but they are not perfect prediction systems.
Financial markets are influenced by:
- Economic news
- Interest rates
- Central bank decisions
- Market sentiment
- Global events
Candlestick analysis works best when combined with:
- Technical analysis
- Risk management
- Patience
- Trading discipline
Successful trading is based on probability, not certainty. Why Most Beginner Traders Lose Money in Forex Trading
Final Thoughts
Candlestick charts are one of the most important tools in technical analysis. They help traders understand market behavior and identify possible trend reversals or continuation patterns.
For beginners, learning basic candlestick patterns can improve chart-reading skills and build a stronger understanding of price action.
Instead of trying to memorize every pattern, focus on mastering a few reliable ones first:
- Hammer
- Shooting Star
- Doji
- Bullish Engulfing
- Bearish Engulfing
Over time, you will become more comfortable reading charts and understanding how buyers and sellers interact in the market.
Remember that trading always involves risk, and no candlestick pattern guarantees success.
The goal is not to predict every move perfectly. The goal is to make informed decisions while managing risk responsibly. XAUUSD Strategy That Helps Traders Pass Prop Firm Challenges Consistently
Frequently Asked Questions (FAQ)
What is the easiest candlestick pattern for beginners?
The Hammer and Bullish Engulfing patterns are usually considered easier for beginners because they are simple to recognize and widely used.
Do candlestick patterns work in forex trading?
Candlestick patterns are commonly used in forex trading to analyze price action and market sentiment. However, they should be combined with proper risk management and technical analysis.
Which timeframe is best for candlestick trading?
Many traders prefer:
- 1-hour charts
- 4-hour charts
- Daily charts
Higher timeframes often provide stronger signals and less market noise.
Are candlestick patterns enough for trading?
No. Most professional traders combine candlestick analysis with:
- Support and resistance
- Trend analysis
- Risk management
- Technical indicators
Can candlestick patterns predict the market?
No trading method can predict the market perfectly. Candlestick patterns only show possible market behavior based on price action.
Do professional traders use candlestick charts?
Yes. Candlestick charts are widely used by professional traders because they provide detailed information about market movement and trader sentiment.
Can candlestick patterns be used in crypto and stocks?
Yes. Candlestick patterns are used in:
- Forex
- Stocks
- Crypto
- Commodities
- Indices
They work across most financial markets because they are based on price action analysis.
About the Author
This educational article was created for beginner traders who want to understand candlestick charts in a simple and practical way. The content is based on commonly used technical analysis principles widely discussed in forex education and trading communities.
Disclaimer: Trading forex and CFDs involves significant risk and may not be suitable for all investors. This article is for educational purposes only and should not be considered financial advice.
More:- Checkout this 05 post if you are new to trading.
01: Funded Forex Accounts: A Professional Guide to Prop Trading in 2026 (Institutional-Level Breakdown)
02: Best Time to Trade XAUUSD (Gold) for Maximum Volatility
03: New York Session Trading Guide – How to Catch Real Moves in Forex & Gold (Without Overtrading)
04: London Session Strategy: How to Catch the Real Move Without Getting Trapped
05: Premium vs Discount Zones Explained: A Practical Guide to Market Value in Forex (SMC Concept)
Pingback: Bitcoin Price Analysis June 2026: BTC/USD Tests Key Support as Sellers Remain in Control