XAUUSD Monthly Analysis (May 2026) – After April Weakness, Will Gold Drop Again or Reverse?
XAUUSD Monthly Analysis May 2026: When trading high-volatility commodities like spot Gold, losing sight of the higher timeframe is the fastest way to blow a funded prop firm account. Retail traders frequently get trapped chasing aggressive intraday green candles on the 5-minute or 15-minute charts, completely unaware that they are buying directly into a massive macro supply zone on the monthly and weekly horizons.
To build a sustainable, long-term edge, professional market analysts utilize Top-Down Multi-Timeframe Analysis. By evaluating structural shifts on the 4-Hour ($4\text{h}$) chart, you can easily identify whether a market rally is a genuine trend reversal or simply a temporary relief bounce designed to trap retail liquidity.
Let’s break down the macro structural footprint of Gold (XAUUSD) to map out our core trading boundaries and execution scenarios for the weeks ahead.
The April Breakdown: Analyzing Institutional Distribution
To understand where Gold is headed, we must first analyze the structural footprint left behind by institutional volume. The market context follows a classic distribution profile:
1. The Loss of Momentum at the Highs
The month started with immense bullish characteristics, printing an aggressive expansion that easily cleared historical swing highs above the 4,800 handle. To the untrained eye, this looked like an unstoppable breakout. However, as price pushed deeper into this premium pricing zone, the buying momentum began to flatten significantly.
2. The Shift into Sharp Distribution
Once retail buyers were fully enticed into buying the top, institutional order flow flipped aggressively. Smart money participants used the available buy liquidity to execute heavy short positions, triggering a rapid, impulsive downward displacement. This move wasn’t random volatility; it was an intentional Break of Structure (BOS) that pushed price down to test the major demand array resting between 4,520 and 4,540.
The Multi-Timeframe Conundrum: 1-Hour Squeeze vs. 4-Hour Reality
To trade like a professional, you must learn to reconcile conflicting signals across different timeframes. When we look at the lower timeframe structure, it tells a very different story than the master macro trend.
- The 1-Hour Short-Squeeze ($4,701$): On the lower timeframes, Gold executed a sharp, V-shaped relief bounce, climbing back up toward the 4,700 psychological handle. This rapid ascent creates intense FOMO (Fear Of Missing Out) among retail day traders, making it look like a complete market reversal.
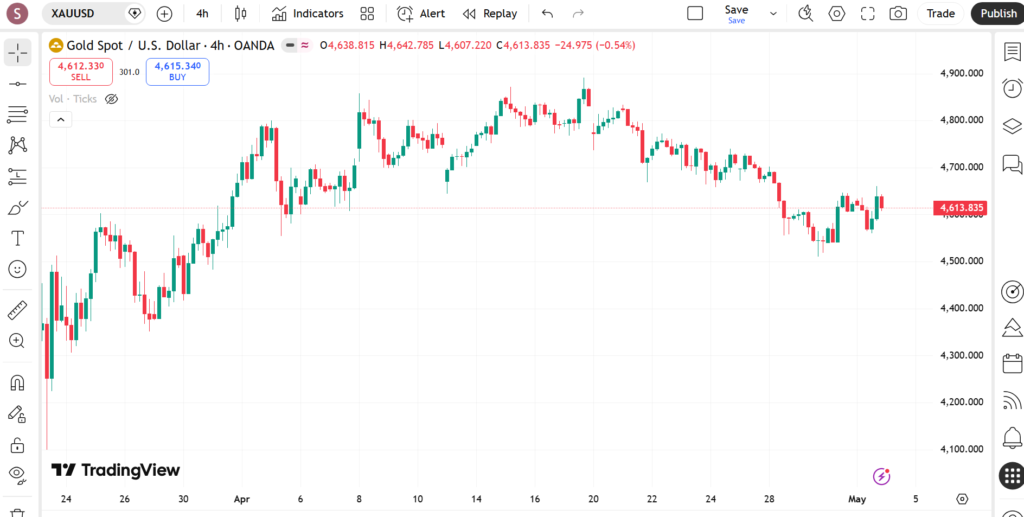
- The 4-Hour Macro Reality ($4,613$): Shifting back to our higher timeframe anchor chart, we see that this entire lower-timeframe rally has failed to secure a permanent structural shift. Price remains heavily contained within a larger bearish order flow matrix, fluctuating down around the 4,613 zone.
The takeaway is clear: the sharp push higher is not a clean structural reversal. It is a text-book premium pullback designed to mitigate unmitigated institutional supply before the next true directional expansion takes place.
Mapping Your Core Macro Zones
By anchoring our perspective to the 4-Hour structure, we can outline the exact pricing corridors where the smart money is highly likely to react:
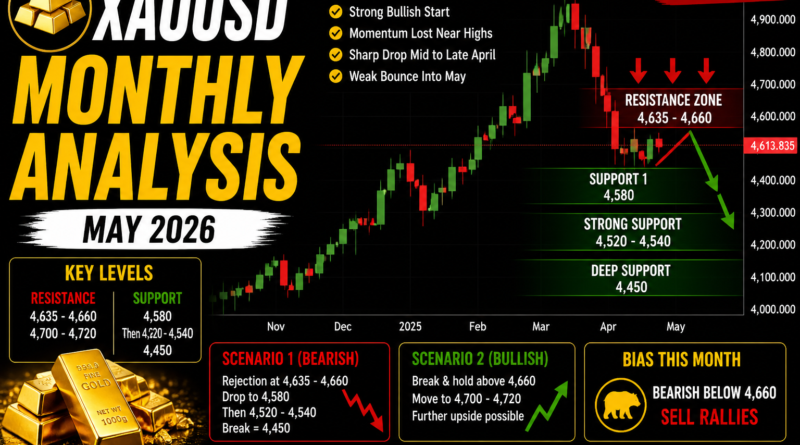
Critical Resistance & Supply arrays
- 4,635 – 4,660 (The Primary Mitigation Block): This corridor represents our line in the sand for bearish control. It is an unmitigated supply zone where sellers previously dominated the tape.
- 4,700 – 4,720 (The Liquidity Ceiling): A major psychological handle. If an intraday short-squeeze manages to push past our primary block, this is the final structural defense line for macro sellers.
Critical Support & Demand Arrays
- 4,580: A minor internal intraday demand level that acts as a short-term stepping stone.
- 4,520 – 4,540: The primary monthly demand baseline. This area represents the origin of the late April institutional buying reaction.
- 4,450: The deep discount target. If macro support fails, this is the next major structural pool where long-term buyers are resting their orders.
Strategic Trading Scenarios
Because professional trading relies entirely on risk-neutral preparation rather than blind prediction, we operate strictly within predefined conditional guardrails:
Scenario A: The Bearish Continuation (Preferred Bias)
As long as the market remains structurally capped below the 4,660 supply block, the overall technical advantage favors selling rallies. If price retests the 4,635 – 4,660 boundary and prints clear rejection wicks or lower-timeframe market structure shifts (CHoCH), look for a continuation play targeting 4,580, with a mid-term extension down to test the 4,540 liquidity pool.
Scenario B: The Structural Reversal
If buyers display genuine institutional conviction and drive a clean 4-Hour candle body close above the 4,660 and 4,700 marks, our bearish thesis is instantly invalidated. A sustained hold above this premium barrier proves that the market has successfully absorbed the overhead supply, opening up an accumulation pathway back toward the historical 4,800+ highs.
Risk Rules for Prop Firm Longevity
When navigating a market caught in a macro transitional phase, capital preservation is your only true priority. Keep these three core principles active:
- Avoid Chasing the Middle: Do not enter trades at random prices like 4,615 or 4,620. Let the market come directly into your major boundaries (4,660 or 4,540) before risking your equity.
- Accept the Invalidation: If price breaks your key zones, accept the loss cleanly. Removing your stop-loss or revenge trading to “prove the analysis right” is the number one reason traders violate their prop firm’s daily drawdown rules.
- Scale Your Positions Judiciously: Because multi-timeframe environments feature high session volatility, scaling down your risk to 0.5% per trade allows you to navigate choppy consolidations without damaging your funded account balance.
Frequently Asked Questions (FAQ)
Why is a monthly analysis different from intraday updates?
A monthly analysis focuses purely on higher-timeframe structural zones and institutional order blocks. It provides an evergreen macro roadmap for the weeks ahead, whereas intraday updates focus on short-term session volatility that can expire within a few hours.
What does “distribution” mean in technical analysis?
Distribution is an institutional market phase where major banking participants and smart money players slowly sell off their large positions to retail buyers near historical highs before initiating a sharp downward trend.
How do you identify a valid zone breakout?
A valid breakout requires a clean candle body close above the structural wick highs on a higher timeframe, such as the 4-Hour or Daily chart. Mere spikes or quick wicks above a level indicate a liquidity sweep rather than a genuine structural shift.
Editorial Notes & Disclaimer
Written by Shah – Forex trader, technical market analyst, and lead editor at Forex News 360.
Risk Disclaimer: Trading spot gold, foreign exchange, and contracts for difference (CFDs) carries a high level of risk and may not be suitable for all investment profiles. All information published within this educational guide is intended solely for informational and research purposes and does not constitute personalized financial or investment advice.
Pingback: XAUUSD Weekly Analysis (May 2026) – Sell Rallies or Reversal Above 4660?