What Is Support and Resistance? Beginner Trading Guide (Easy Explanation)
Support and resistance in trading, are two of the most important building blocks in technical analysis. Every trader whether trading Forex, Gold (XAUUSD), Bitcoin, or stocks, relies on these levels in some form to understand where price may react.
If you learn this concept properly, you stop “guessing” the market and start reading price behavior more logically.
This guide breaks everything down in simple language with real trading logic so you can actually use it on your charts.
What Are Support and Resistance in Trading?
In simple terms:
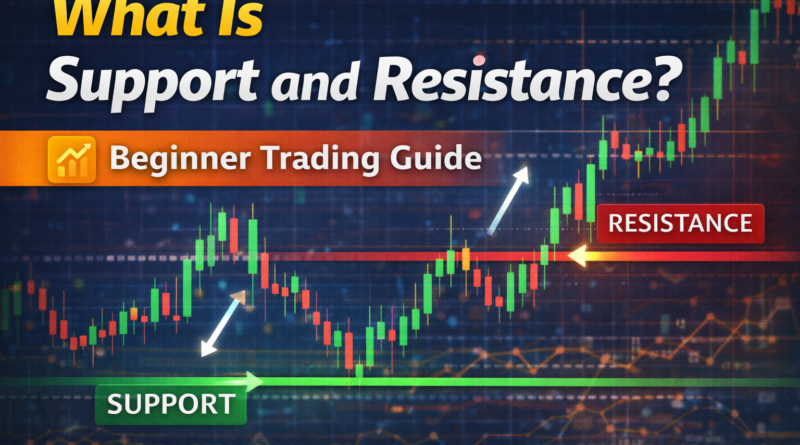
- Support = price level where buying pressure appears
- Resistance = price level where selling pressure appears
These levels are not random lines. They are areas where market participants make decisions. Kill Zones in Forex: Smart Money Timing Strategy That Actually Makes Sense
Core Idea:
Price does not move in a straight line. It moves in waves:
- Up → pause → down
- Down → pause → up
Support and resistance are the “pause zones” where this behavior happens.
What Is Support?
Support is a price level where a falling market stops going down and starts moving up.
It happens because:
- Buyers enter the market
- Selling pressure slows down
- Demand becomes stronger than supply
Simple Analogy:
Support is like a floor under the price.
When price hits the floor, it “bounces” upward.
Example:
If Bitcoin drops to 60,000 and then starts rising again:
- That 60,000 zone becomes support
- Buyers defended that level
Key Insight:
Support is not a single exact price, it is a zone where buyers react.
What Is Resistance?
Resistance is the opposite of support.
It is a price level where a rising market stops going up and starts falling.
This happens because:
- Sellers enter the market
- Buying pressure weakens
- Supply becomes stronger than demand
Simple Analogy:
Resistance is like a ceiling above price.
When price hits it, it gets rejected downward.
Example:
If Gold (XAUUSD) rises to 2400 and then falls:
- That 2400 area becomes resistance
- Sellers defended that level
Key Insight:
Like support, resistance is also a zone, not a precise line.
Why Support and Resistance Matter
Support and resistance are important because they show where market reactions are likely to happen.
Traders use them to:
- Identify entry points
- Place stop-loss orders
- Plan profit targets
- Spot breakouts and reversals
Professional Perspective:
Institutions don’t see “lines.” They see:
- Liquidity zones
- Order clusters
- Areas of interest
Support and resistance are simply a simplified retail version of these ideas. XAUUSD Strategy That Helps Traders Pass Prop Firm Challenges Consistently
How to Use Support and Resistance in Trading
Now let’s turn theory into practical trading logic.
1. Buying at Support (Bounce Strategy)
When price reaches a support zone, traders look for buying opportunities.
Basic Idea:
- Price falls into support
- Shows rejection or slowing momentum
- Buyers regain control
- Price moves upward
Entry Logic:
Do NOT buy immediately at support.
Wait for confirmation like:
- Bullish candle rejection
- Higher low formation
- Break of minor structure upward
Key Insight:
Support is only useful if it shows reaction, not just touch.
2. Selling at Resistance (Rejection Strategy)
At resistance, traders look for selling opportunities.
Basic Idea:
- Price rises into resistance
- Momentum weakens
- Sellers step in
- Price drops
Entry Logic:
Look for confirmation such as:
- Bearish engulfing candle
- Lower high formation
- Break of structure downward
Key Insight:
Resistance works best when price shows clear rejection, not hesitation. Why 90% of Traders Fail Funded Challenges in Phase 1: The Brutal Truth
3. Trading Breakouts (Advanced Use)
Sometimes price does not bounce, it breaks.
Breakout Concept:
- Price breaks above resistance → bullish continuation
- Price breaks below support → bearish continuation
Important Rule:
Not all breakouts are real.
Many are false breakouts (liquidity grabs) designed to trap traders.
Confirmation for Breakouts:
- Strong candle close beyond level
- Retest of broken level
- Momentum continuation
Common Mistakes Traders Make
Most beginners lose money not because support and resistance is wrong, but because they use it incorrectly. Best Time to Trade XAUUSD (Gold) for Maximum Volatility
1. Drawing Too Many Levels
Too many lines = confusion.
Focus only on:
- Clear highs and lows
- Strong reaction zones
2. Ignoring Market Trend
Support in a downtrend often breaks.
Resistance in an uptrend often breaks.
Always align with trend direction.
3. Entering Without Confirmation
Touching a level is not enough.
You need:
- Price reaction
- Structure confirmation
- Momentum shift
4. Treating Levels as Exact Prices
Support and resistance are zones, not exact lines.
Price may slightly overshoot before reacting.
How Professionals Use Support and Resistance
Institutional traders do not rely on simple lines.
They combine support and resistance with:
- Market structure (BOS / CHoCH)
- Liquidity zones
- Order blocks
- Volume behavior
Key Professional Concept:
Support and resistance are often areas where: Liquidity is concentrated, not just price reactions. Order Block Entry Strategy: Step-by-Step Guide (Real Trader Approach)
Simple Trading Framework Using Support and Resistance
Here is a clean beginner structure:
Step 1: Identify Key Levels
- Mark major highs and lows
- Focus on higher timeframe (H4, Daily)
Step 2: Wait for Price to Reach Zone
Do not chase price.
Step 3: Look for Reaction
- Rejection candles
- Momentum shift
- Structure change
Step 4: Enter With Confirmation
Never enter blindly at the level.
Step 5: Manage Risk
- Stop-loss beyond structure
- Target next opposite level
Support vs Resistance Summary
| Concept | Meaning | Market Behavior |
|---|---|---|
| Support | Buying zone | Price bounces upward |
| Resistance | Selling zone | Price drops downward |
Simple Memory Trick:
- Support = Floor (price bounces up)
- Resistance = Ceiling (price gets rejected)
Final Conclusion
Support and resistance are foundational concepts in trading. They help you understand where price is likely to react, pause, or reverse.
However, they are not standalone signals.
They become powerful only when combined with:
- Market trend
- Price action confirmation
- Structure analysis
- Risk management
Key Takeaway: Support and resistance do not predict the market, they help you interpret where reactions are most likely to happen.
If you master this concept and practice it on live charts, you will start seeing structure in the market instead of random movement.
Disclaimer
Disclaimer: Trading forex and CFDs involves significant risk and may not be suitable for all investors. This article is for educational purposes only and should not be considered financial advice.
Written by Shah – Forex trader and market analyst at Forex News 360.
This is best for new traders :
Pingback: Candlestick Patterns: How to Read Candlestick Charts (Beginner Guide)