How to Trade the Break of Structure Pullback in Gold (XAUUSD Strategy Guide)
Learning how to accurately identify a Gold Break of Structure is one of the most critical skills an independent technical analyst can master. One of the biggest mistakes retail forex traders make is trying to catch a falling knife. When a market is in a powerful, multi-day downtrend, it is easy to mistake a sharp intraday rally for a full trend reversal.
To avoid falling into this trap, professional traders rely on a core rule of market structure: The Break of Structure (BOS) Pullback.
By learning how to identify when a rally is just a temporary pullback into a premium supply zone, you can trade with institutional order flow rather than fighting it. Let’s break down exactly how to analyze this setup using the recent price action on the Gold (XAUUSD) 15-minute chart.
The Core Concept: Pullback vs. Reversal
In a healthy bearish market structure, price moves in a series of lower lows and lower highs. When institutions push the price down to break a previous major low, it creates a Break of Structure (BOS).
However, markets do not move in a straight line. After a massive expansion downward, the market naturally experiences a relief bounce. This happens for two reasons:
- Institutional sellers are closing out some of their short positions, which causes short-term buying pressure.
- Retail traders see the cheap prices and begin aggressively buying the “dip.”
The key to surviving funded trading challenges is recognizing that this bounce is not a trend reversal. It is simply a technical pullback designed to mitigate an unmitigated supply zone or order block before the real downtrend continues.
Analyzing the 15-Minute Gold Structure
Let’s look directly at the structural footprints left behind on the 15-minute OANDA Gold chart to map out our intraday execution zones.
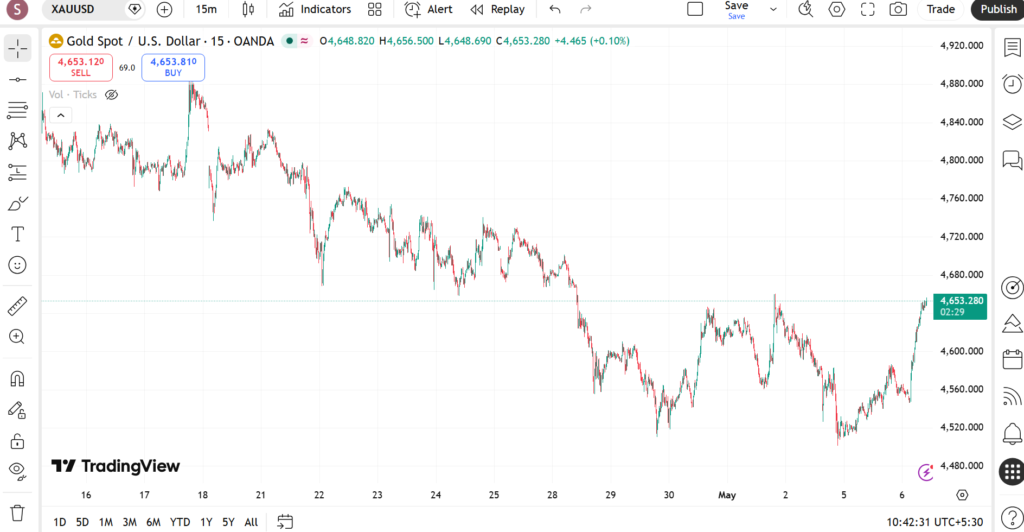
1. The Strong Sell-Off and Relief Baseline
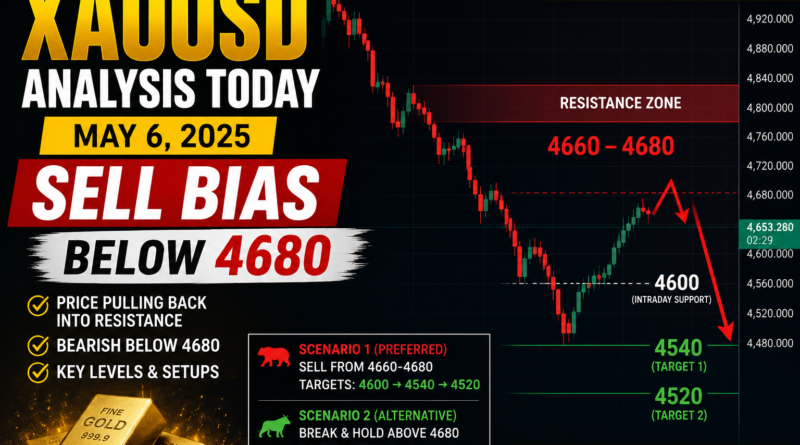
For several consecutive sessions leading up to this move, Gold was trapped under intense institutional selling pressure. This steady downward drive culminated in a final liquidity sweep into the 4,520 – 4,540 demand array.
Once the stop-losses of early buyers were completely cleared out at the lows, an aggressive intraday short-squeeze began. Price launched upward, climbing rapidly toward the 4,650 area.
2. Identifying the Trap Below Resistance
To an untrained retail trader, this sudden vertical green line looks incredibly bullish, temptingly signaling a breakout. But when we look at the broader framework, we see this aggressive push is flying straight into a major breakdown structure.
The 4,660 – 4,680 zone previously acted as a strong baseline of support. When the market broke below it earlier in the week, that old support automatically flipped into a major resistance and supply zone. Because the initial breakdown happened so fast, institutional banks left behind unfilled sell orders in that exact block. This rapid intraday rally is simply price returning to efficiently fill those orders.
Mapping Your Execution Scenarios
Because trading is a game of probabilities, an elite analyst never guesses. Instead, we map out clear operational guardrails based on how price reacts inside our key decision zone.
Scenario A: The Bearish Continuation (Preferred Setup)
As long as Gold remains safely below the 4,680 threshold, our macro structural bias stays strictly bearish.
If price pushes directly into the 4,660 – 4,680 supply pocket and begins printed heavy rejection wicks or lower-timeframe bearish engulfing candles, it confirms that institutional sellers are actively defending their block. This provides a high-probability short entry, targeting a structural roll-over back down toward 4,600, and eventually a retest of the recent 4,540 liquidity lows.
Scenario B: The Bullish Invalidation
No technical setup is 100% guaranteed. If buyers manage to sustain this momentum, breaking cleanly through the 4,680 ceiling and securing a strong candle body hold above the 4,700 – 4,720 supply zone, our bearish thesis is completely invalidated.
A clean structural reclaim of this area proves that genuine, long-term institutional buyers have taken control of the order flow, turning the temporary pullback into a legitimate market reversal toward 4,750.
Strategic Lessons for Prop Firm Traders
When trading highly volatile assets like Gold during intraday sessions, discipline overrides prediction every single time. Keep these three core rules in mind:
- Never Chase Price in No-Man’s Land: Entering a trade at 4,650—right in the middle of the range—forces you to use an unsustainably wide stop-loss, ruining your risk-to-reward ratio. Wait patiently for price to reach the extreme boundaries of your zone.
- Look for Session Volatility Signals: Intraday moves on Gold are heavily driven by liquidity hunts during the London and New York session opens. Watch for sudden wicks at these times to identify where the smart money is fishing for stops.
- Protect Your Daily Drawdown Limit: Because Gold moves fast, keep your position sizes tightly calculated. Risking no more than 0.5% to 1% on a structural pullback setup ensures that even if an invalidation occurs, your funded challenge account stays perfectly safe to trade another day.
Frequently Asked Questions (FAQ)
What does “support turned resistance” mean in trading?
When a price floor (support) is broken by an aggressive downward move, that level naturally flips into a price ceiling (resistance) when the market attempts to rally back up. This happens because institutional traders look to mitigate old positions around the original breakdown point.
Why is an intraday pullback dangerous for retail traders?
Intraday pullbacks often look incredibly strong and fast on lower-timeframe charts, tricking retail traders into believing a new uptrend has started. In reality, these fast moves are often traps engineered to pull buyers into historical supply zones where major banks are waiting to sell.
How do you confirm a true trend reversal on Gold?
A true reversal requires more than just a quick price spike. It requires a confirmed Change of Character (CHoCH) followed by a higher low structure, proving that the market is successfully shifting its long-term institutional order flow.
Editorial Notes & Disclaimer
Written by Shah – Forex trader, technical market analyst, and lead editor at Forex News 360.
Risk Disclaimer: Trading spot gold, foreign exchange, and contracts for difference (CFDs) carries a high level of risk and may not be suitable for all investment profiles. All information published within this educational guide is intended solely for informational and research purposes and does not constitute personalized financial or investment advice.his bearish idea is weak.
That would signal stronger buyers stepping in.