
XAUUSD Weekly Analysis: Gold Holds Bullish Structure but Major Resistance Still Ahead
XAUUSD Weekly Analysis: Navigating the global financial markets requires a clear understanding of higher timeframe order flow. When trading highly volatile assets like spot Gold, it is easy to get trapped by short-term session noise. To stay on the right side of the market, professional analysts look at the broader multi-day structural framework to identify where institutional liquidity rests.
In this weekly analysis, we break down the current market structure of Gold (XAUUSD) using a 4-Hour chart framework. We will map out the major institutional supply and demand zones, analyze current session momentum, and outline the key execution scenarios for the trading week ahead.
The Broad Structural Context: 4-Hour Order Flow
Over the past few weeks, Gold has been establishing a clear recovery phase following a sharp bearish displacement. When analyzing the market through the lens of institutional order flow, the price action reveals a classic battle between premium supply and discount demand.
1. The Institutional Liquidity Base (The Support Zone)
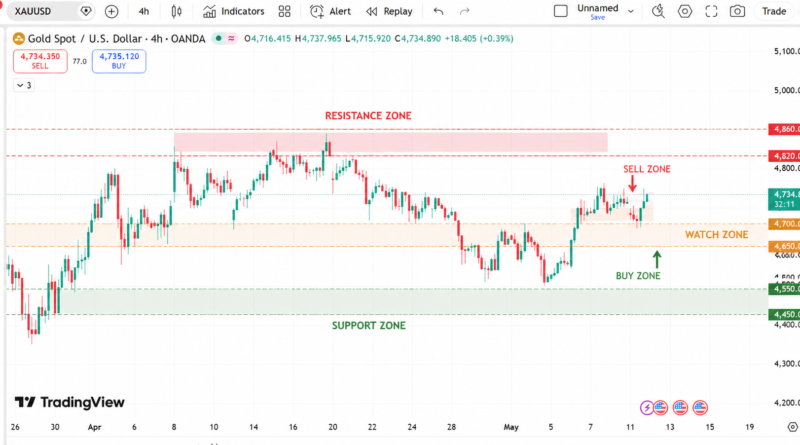
During the late April sell-off, Gold experienced heavy downward pressure that pushed prices directly into the 4,500 – 4,550 region. While retail traders panicked, thinking the market was collapsing, institutional participants used this deep discount array to sweep retail stop-losses and accumulate massive long positions. Notice how the green Support Zone held perfectly on the chart. This strong bullish reaction zone serves as our primary macro defensive baseline.
2. The Premium Supply Ceiling (The Resistance Zone)
Following the accumulation at the lows, buyers returned aggressively to initiate a steady recovery rally, forming a clean series of higher lows. However, as price approaches the 4,820 – 4,860 red Resistance Zone, upside momentum is beginning to slow down.
This pink structural box represents an unmitigated bearish order block—the exact origin point of the aggressive multi-day sell-off from mid-April. Because price is re-entering this premium pricing zone, short-term buyers are naturally taking profits, and major institutional sell limits are being triggered, causing the market to consolidate.
Understanding the Intraday Execution Corridors
To maximize technical precision, we must look at how price is navigating the internal zones leading up to that major resistance ceiling.
The Active Sell Zone ($4,734$)
As filtered down on the 4-Hour chart, Gold is currently trading around the 4,734 level, marked as our immediate Sell Zone. Price is currently experiencing minor friction here as it mitigates internal lower-timeframe liquidity. Chasing long positions directly into this immediate intraday ceiling carries a poor risk-to-reward ratio.
The Institutional Watch Zone ($4,650 – 4,700$)
If sellers manage to force a short-term rejection from the current 4,734 handle, expect a technical pullback into the orange Watch Zone ($4,650 – 4,700$). This corridor is highly critical for mid-term trend continuation. It represents a flipped market structure where old resistance is being tested as new support. If buyers step in to defend this orange block, it will confirm a clean structural higher low, giving the market the necessary fuel to challenge the major overhead supply ceiling.
Developing Your Trading Plan: Key Scenarios
Because consistent trading relies on mapping out objective boundaries rather than predicting the future, we must prepare for two highly realistic market scenarios this week:
Scenario A: The Bullish Breakout Expansion
If buyers successfully defend the internal support structures and push Gold cleanly above the 4,860 red resistance block with strong candle-body momentum, the bearish order block will be officially invalidated. A clean structural breakout here shifts the macro target back toward the psychological 5,000 milestone, drawing massive trend-following volume into the market.
Scenario B: The Corrective Mitigation Phase
If the market repeatedly fails to close above the 4,820 – 4,860 premium ceiling, short-term profit-taking will take over. Sellers will look to drive price down past the internal watch zones for a deeper corrective phase. Under this framework, look for a mitigation run back down toward the primary 4,550 structural demand zone before buyers attempt a broader trend continuation.
Strategic Takeaways for Funded Traders
Managing capital safety during a weekly transition requires complete emotional detachment. Keep these rules at the center of your execution plan:
- Exercise True Patience: Buying right below a historical 4-Hour supply zone is a textbook retail mistake. Let the market either break cleanly above the ceiling or pull back deeply into your designated buy arrays before risking capital.
- Anchor to the Highs and Lows: Use your daily and session pivots to gauge genuine strength. Avoid getting chopped up in the middle of the 4,650 – 4,734 intraday range where price moves sideways.
- Keep Position Sizing Strict: Because Gold exhibits high average daily ranges, keeping your risk limited to a strict 0.5% or 1% per trade ensures you stay well within your prop firm’s maximum daily loss limits, protecting your longevity in the market.
Frequently Asked Questions (FAQ)
What makes a 4-hour resistance zone highly significant?
A 4-Hour resistance zone holds substantial weight because it represents structural price action tracked by institutional algorithms and commercial banks. Rejections or breakouts on this timeframe carry far more directional weight than minor intraday patterns on a 5-minute chart.
Why is the orange watch zone labeled as support?
The orange watch zone ($4,650 – 4,700$) acts as support because it represents a key structural flip. In technical price action, once an established resistance ceiling is cleanly broken, it naturally switches roles to become a demand floor when price returns to retest the level.
What should a prop trader do during market consolidation?
When a major asset like Gold enters a consolidation phase below resistance, the safest approach is to stand aside. Waiting for a clear liquidity sweep or a confirmed candle body breakout prevents your account from suffering minor drawdown paper cuts inside a tight trading range.
Editorial Notes & Disclaimer
Written by Shah – Forex trader, technical market analyst, and lead editor at Forex News 360.
Risk Disclaimer: Trading spot gold, foreign exchange, and contracts for difference (CFDs) carries a high level of risk and may not be suitable for all investment profiles. All information published within this educational guide is intended solely for informational and research purposes and does not constitute personalized financial or investment advice.