How to Trade Gold Using Premium vs. Discount Zones (XAUUSD Structural Guide)
When analyzing global financial markets, mastering Gold Premium vs Discount Zones is the ultimate key to understanding institutional market structure. Many retail traders fail because they buy when the price is moving up aggressively, only to see the market reverse immediately. To avoid getting caught on the wrong side of the market, professional traders rely on these specific algorithmic pricing zones.
To avoid getting caught on the wrong side of the market, professional traders rely on a simple core concept: Premium vs. Discount Zones.
By understanding where the institutional banks want to buy and sell, you can easily filter out bad setups and keep your funded trading accounts safe. Let’s break down exactly how this works using recent price behavior on the Gold (XAUUSD) 1-Hour chart.
What are Premium and Discount Zones?
Think of the financial markets like any normal retail business. If you own a shop, you want to buy your inventory at a cheap wholesale price and sell it to customers at a higher retail price to make a profit.
The market works exactly the same way:
- Discount Zone (The Wholesale Price): This is the lower half of a trading range. It is the cheap area where major institutions and commercial banks look to fill massive buy orders.
- Premium Zone (The Retail Price): This is the upper half of a trading range. It is the expensive area where smart money looking to take profits or open short (sell) positions.
When you learn to view the market through these zones, your entire perspective changes. You stop chasing fast green candles near the highs and start waiting patiently for deep pullbacks into high-probability discount areas.
Analyzing the Gold Chart Structure
Let’s look at a real-world example using recent price action on the 1-Hour Gold chart. By studying the structural swings, we can map out the battle between buyers and sellers.
1. The Institutional Liquidity Sweep
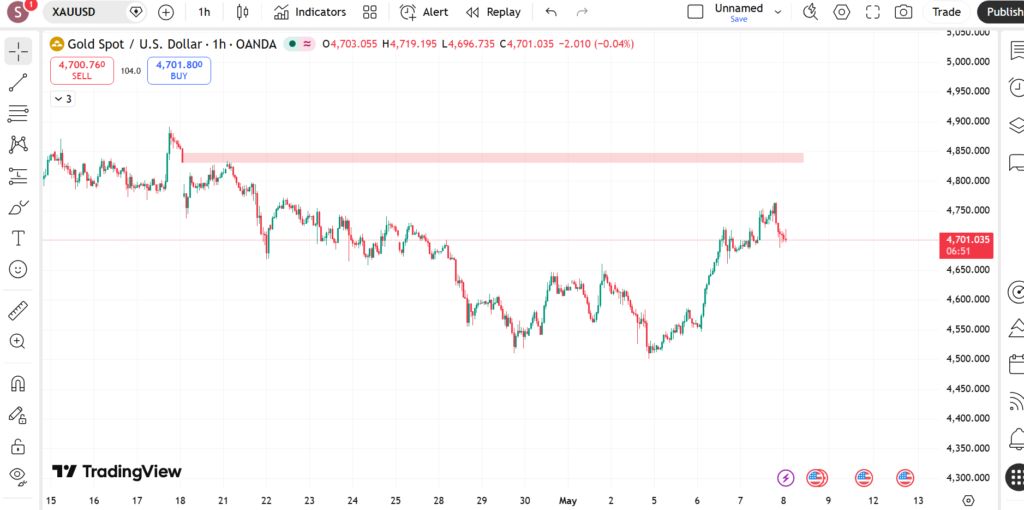
In the first half of the chart, Gold experienced a strong, aggressive downward move that pushed price all the way down toward the 4,500 area. To a retail trader, this looks like a terrifying collapse. However, to an institutional buyer, this deep drop was a deliberate search for liquidity.
By pushing the market below previous swing lows, major market participants triggered the stop-losses of retail buyers, creating a massive pool of sell orders. The smart money used this deep Discount Zone to absorb those sell orders and accumulate heavy long positions.
2. The Shift in Market Character
Once the liquidity was cleanly swept at the lows, the market structure shifted. Buyers stepped into the market aggressively, creating a sharp, V-shaped recovery. This rapid push upward broke past multiple short-term swing highs, confirming a lower-timeframe Change of Character (CHoCH).
This structural break tells us that institutional order flow has flipped from bearish to bullish, and the momentum is now pointing upward.
3. Facing the Premium Order Block
Following that beautiful recovery, notice how the bullish momentum begins to slow down significantly as price approaches the 4,830 to 4,850 region (represented by the pink structural box on the chart).
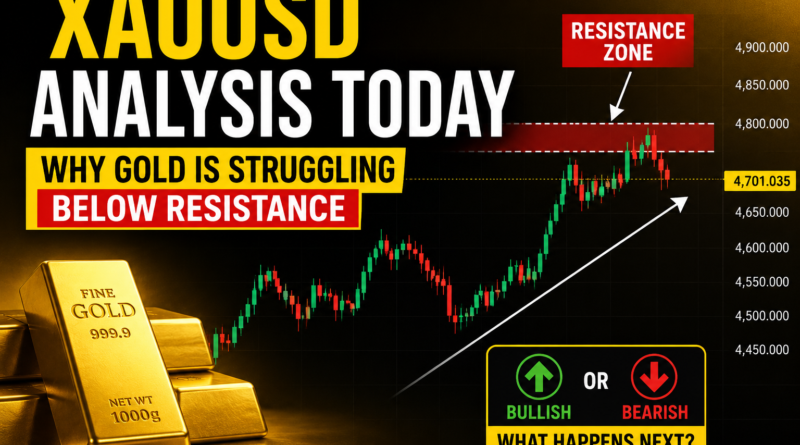
Why is Gold struggling to continue higher right here? The answer is simple: Price has left the cheap discount zone and has entered a Premium Pricing Zone. The pink box marks an old supply area where institutional sellers left behind unmitigated sell orders during the mid-April drop. As price re-enters this expensive zone, short-term buyers begin taking profits, and sellers step back in to defend their old positions. This natural friction causes the market to move sideways into a consolidation phase.
What Happens Next? Two Realistic Scenarios
Because Gold is currently trapped inside an important structural decision zone, we must remain objective and plan for both potential market scenarios.
Scenario A: The Bullish Reclaim
If buying pressure remains resilient and the market manages to secure a clean 1-Hour candle body close above the 4,850 resistance block, it will invalidate the bearish supply zone. This breakout would signal that institutions are ready to push prices higher, opening the path for a fresh expansion back toward the psychological 5,000 milestone.
Scenario B: The Premium Mitigation Pullback
Since price is deep inside a premium zone, chasing buys inside the pink box carries a very high risk. A healthy technical correction is highly probable. If sellers successfully defend this block, look for Gold to drop back down to mitigate an internal demand level or Fair Value Gap (FVG) near the 4,650 support zone.
As long as the market forms a higher low above the structural 4,500 swing low, the mid-term recovery framework remains completely intact.
Key Takeaways for Funded Traders
To protect your prop firm accounts and maximize your win rate, keep these rules in mind when trading highly volatile assets like Gold:
- Never buy in a Premium Zone: No matter how bullish a chart looks, entering a long trade directly into a major historical supply zone is a recipe for disaster.
- Practice Contentment and Patience: Wait for the market to come to your designated zones. If you miss the initial move from the bottom, wait for a pullback instead of chasing the breakout impulsively.
- Let the Lower Timeframe Confirm: When price enters your higher-timeframe discount or premium zones, drop down to a 5-minute or 15-minute chart to look for a clean structural shift before placing your trade.
Frequently Asked Questions (FAQ)
What is a premium zone in forex trading?
A premium zone represents the upper half of a defined trading range where prices are historically expensive. Smart money participants typically look to secure profits or execute sell positions in this area, rather than buying.
Why does gold struggle at historical resistance zones?
Gold often slows down at major resistance zones because those areas contain old institutional sell orders (Order Blocks) that haven’t been filled yet. When price returns to these levels, selling pressure increases significantly.
What is an institutional liquidity sweep?
A liquidity sweep occurs when large market participants intentionally push prices past obvious support or resistance levels to trigger retail stop-loss orders. This creates the massive transaction volume needed for institutions to enter large positions without moving the market against themselves.
Editorial Notes & Disclaimer
Written by Shah – Forex trader, technical market analyst, and lead editor at Forex News 360.
Risk Disclaimer: Trading spot gold, foreign exchange, and contracts for difference (CFDs) carries a high level of risk and may not be suitable for all investment profiles. All information published within this educational guide is intended solely for informational and research purposes and does not constitute personalized financial or investment advice.