Bitcoin (BTC/USD) Analysis: Sharp Breakdown Puts Bears in Control
Bitcoin Remains Under Pressure After Sharp Sell-Off
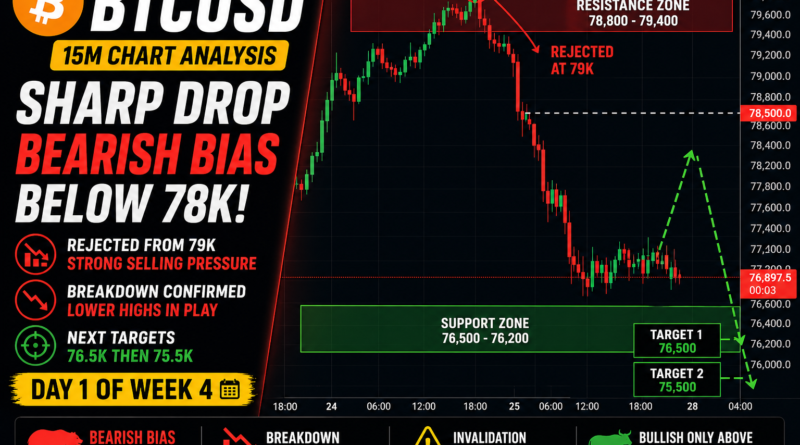
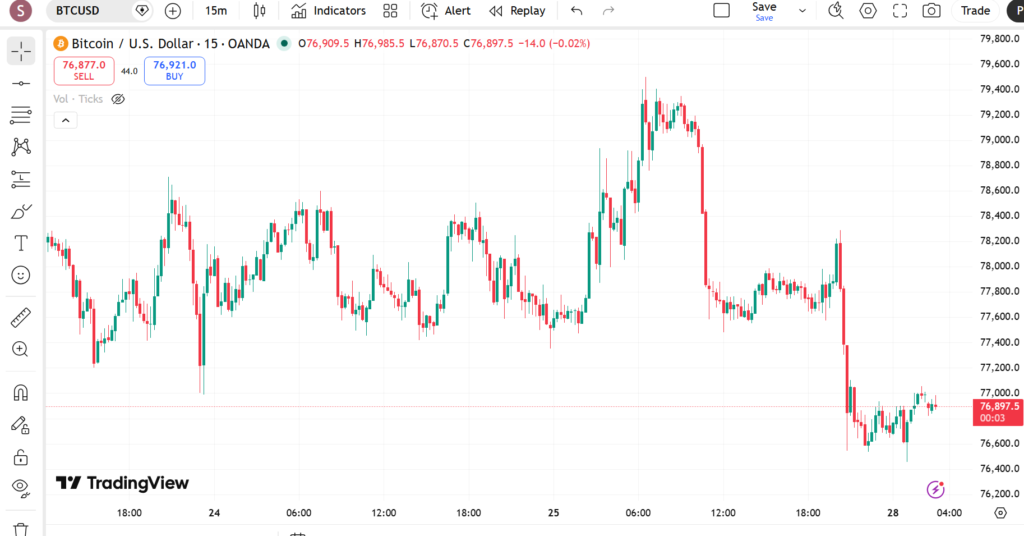
Bitcoin (BTC/USD) is currently trading near the $76,200–$76,400 region after experiencing a strong rejection from the $79,000 area earlier in the week. The recent price action has shifted market sentiment from bullish momentum to cautious consolidation, with traders now watching whether Bitcoin can recover higher levels or continue moving lower.
The earlier drop was aggressive and impulsive rather than slow and controlled. In technical analysis, sharp sell-offs like this often suggest strong selling pressure entering the market instead of simple profit-taking. After reaching the $75,000 support zone, Bitcoin managed to bounce slightly, but buyers have not shown enough strength to fully reverse the bearish momentum.
At the moment, price action appears choppy and range-bound, which usually signals market indecision after a major move.
Current Bitcoin Market Structure
Bitcoin is now trading in the middle of a short-term range, which makes this an important decision area for traders.
The market recently formed lower highs after failing to maintain strength above the $79K region. This change in structure suggests sellers still have some control over short-term momentum.
Although the bounce from the $75K area prevented further immediate downside, the recovery has been weak so far. Instead of aggressive bullish continuation, Bitcoin continues printing rejection wicks and slow upward moves, which often indicates hesitation from buyers.
Because of this, many traders are treating the current move as either:
- A temporary consolidation before another bearish leg lower
- Or an early accumulation phase before a larger recovery
For now, the bearish side still has a slight advantage unless Bitcoin reclaims major resistance levels.
Important BTCUSD Levels to Watch
Resistance Zone: $77,200 – $77,800
This area is currently acting as the nearest resistance zone for Bitcoin. It previously served as a rejection area where sellers stepped back into the market.
If price moves into this region and struggles to break above it, sellers may attempt to push Bitcoin lower once again.
Lower highs forming below resistance often support a bearish continuation structure.
Major Resistance: $78,800 – $79,200
This remains the major distribution zone from the recent sell-off.
A successful breakout above this area would significantly improve bullish momentum and could shift market structure back in favor of buyers.
Until that happens, many traders will remain cautious about chasing long positions.
Support Zone: $75,200 – $74,800
This area acted as strong demand during the recent decline and helped Bitcoin stabilize after the aggressive sell-off.
If Bitcoin revisits this zone again, traders will closely monitor whether buyers defend support or whether sellers break through it with momentum.
A breakdown below this region could increase downside pressure across the crypto market.
Intraday Support: $76,000
Bitcoin is currently testing the $76K area as short-term support.
Holding above this level may allow temporary consolidation or a minor recovery. However, if price breaks below it with strong selling momentum, the market could quickly revisit the lower support zones near $75K.
Technical Analysis: Sellers Still Hold the Edge
From a technical perspective, Bitcoin’s short-term structure still leans slightly bearish.
The earlier breakdown damaged bullish momentum and shifted price action into a lower-high formation. Even though the market bounced from support, the recovery lacks strong continuation strength.
One key detail traders often watch is the quality of market reactions:
- Strong bullish markets usually produce aggressive recoveries after dips.
- Weak recoveries after sharp sell-offs often indicate cautious buyers and active sellers.
Right now, Bitcoin appears stuck in a consolidation phase rather than showing signs of a confirmed reversal.
As long as price remains below the $77.5K–$78K area, downside risk may continue dominating short-term movement.
Possible Bitcoin Trading Scenarios
Scenario 1: Rejection From Resistance
If Bitcoin pushes into the $77,200–$77,800 resistance zone and fails to break higher, sellers may look for downside continuation.
Possible downside targets include:
- $76,000
- $75,200
- Lower support if selling pressure increases
This setup aligns with the current bearish intraday structure and lower-high formation.
Scenario 2: Breakdown Below $76,000
If Bitcoin breaks below the $76K support level with strong momentum, the next downside targets may sit around:
- $75,200
- $74,800
A clean breakdown would confirm continued seller control and could trigger increased volatility.
Alternative Bullish Scenario
Although the current bias remains cautious and slightly bearish, traders should remain flexible.
If Bitcoin breaks above the $78K–$78.5K region and successfully holds above it, market sentiment could shift back toward buyers.
In that case, traders may begin watching for pullback buying opportunities targeting a possible return toward the $79K region or higher.
Why Today’s Price Action Matters
Bitcoin is currently sitting near the middle of its short-term range, making this an important area for market direction.
The next major move may help determine whether:
- The bearish structure continues toward lower support
- Or buyers regain control and reclaim higher resistance levels
With no major macroeconomic catalyst dominating the market today, price action may remain heavily driven by technical levels, liquidity grabs, and session-based volatility.
This environment often creates fake breakouts and sharp reversals, especially during high-volume trading sessions.
Final Thoughts
Bitcoin continues trading inside a cautious consolidation phase after a strong rejection from the $79K area. While the market has stabilized above recent lows, buyers still need to reclaim important resistance levels before confidence fully returns.
For now, traders may focus on:
- Watching reactions near resistance zones
- Monitoring the $76K support level
- Avoiding emotional trades in the middle of the range
Until Bitcoin reclaims the $78K region with strength, the short-term structure remains slightly bearish.afterward. Bitcoin did not bounce aggressively after reaching lower levels. Instead, price entered a weak consolidation phase, which often signals bearish continuation rather than strong accumulation.
Written by Shah – Forex trader, technical market analyst, and lead editor at Forex News 360.
Risk Disclaimer: Trading spot gold, foreign exchange, and contracts for difference (CFDs) carries a high level of risk and may not be suitable for all investment profiles. All information published within this educational guide is intended solely for informational and research purposes and does not constitute personalized financial or investment advice.