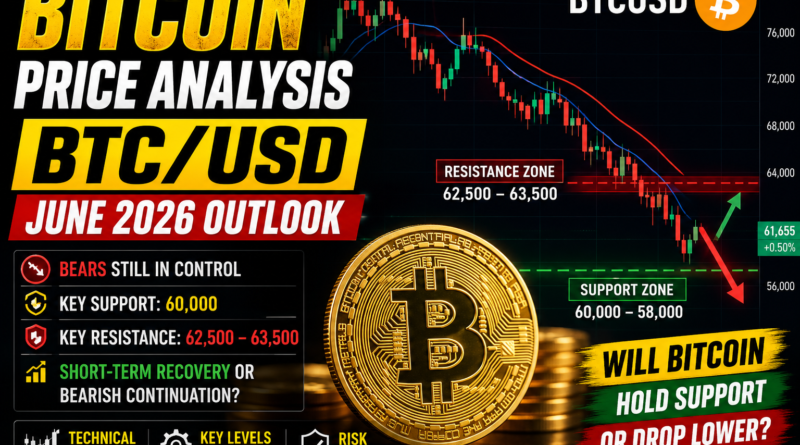
Bitcoin June 2026: BTC/USD Under Heavy Selling Pressure as Key Support Faces a Major Test
Bitcoin Price Analysis June 2026: Bitcoin (BTC/USD) has entered June under significant selling pressure after experiencing a sharp decline from the 80,000 region toward the 60,000 area. While buyers have recently attempted a recovery, the broader market structure remains bearish on higher timeframes.
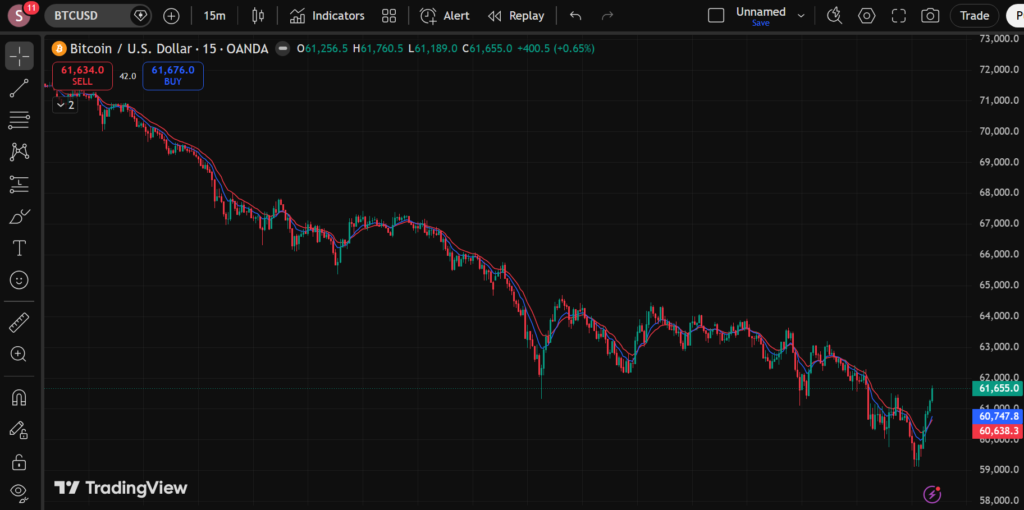
Based on the latest 4-hour and 15-minute charts, Bitcoin is currently trading around 61,600, with traders closely watching whether the current bounce can develop into a larger recovery or if sellers will regain control.
This article is provided for educational purposes only and should not be considered financial or investment advice.
Market Overview
Bitcoin has experienced a strong bearish move over the past several weeks.
The recent decline highlights several important factors:
- Strong bearish momentum
- Lower highs and lower lows
- Price trading below key moving averages
- Increased market volatility
- Weak bullish follow-through on higher timeframes
Although buyers have managed to create a short-term bounce, the overall trend remains under pressure until key resistance levels are reclaimed.
If you’re new to cryptocurrency trading, you may also find this guide helpful:
How to Trade Bitcoin for Beginners: A Simple 2026 Guide
https://forexnews360.com/free-guide/bitcoin-trading-for-beginners-guide/
What the 4-Hour Chart Shows
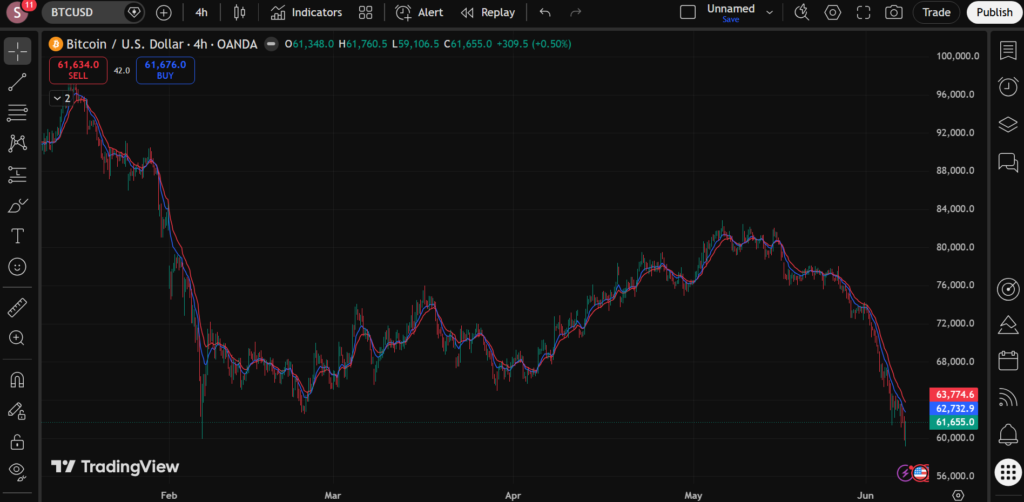
The 4-hour chart provides the broader market picture and remains the most important timeframe for swing traders.
Key Observations
Downtrend Structure Remains Active
Bitcoin continues to print lower highs and lower lows. This remains one of the clearest signs that sellers are still controlling the overall trend.
For traders learning how market direction is identified, read:
Market Bias in Forex: Institutional Smart Money Guide to Directional Trading (SMC Concept)
https://forexnews360.com/free-guide/market-bias-in-trading/
Bearish Moving Average Alignment
The shorter moving average remains below the longer moving average, showing that downside momentum is still dominant.
Related guide:
Moving Averages (EMA vs SMA): Complete Beginner Guide for Forex, Gold & Crypto Traders
https://forexnews360.com/free-guide/moving-averages-ema-vs-sma/
Strong Breakdown from Higher Levels
The decline from the 80,000 area demonstrates aggressive selling activity. Large bearish candles often indicate institutional participation and increased market fear.
Buyers Are Attempting a Recovery
The latest candles show some buying interest near the 60,000 support area. However, one bullish bounce does not automatically signal a trend reversal.
Important Support Levels
These support zones may become important during June trading.
Support 1: 60,000
This is currently the most important psychological support level.
A strong defense by buyers may create a larger recovery.
Support 2: 58,000
If 60,000 fails, sellers may target the next support area around 58,000.
Support 3: 56,000
This could become the next downside objective if bearish momentum accelerates.
For traders wanting to better understand support zones:
What Is Support and Resistance? Beginner Trading Guide (Easy Explanation)
https://forexnews360.com/free-guide/support-and-resistance-in-trading/
Important Resistance Levels
Resistance 1: 62,500–63,500
The first major resistance zone that may attract fresh selling pressure.
Resistance 2: 66,000–68,000
A stronger resistance area where previous breakdowns occurred.
Resistance 3: 72,000
A break above this level would significantly improve Bitcoin’s technical outlook.
What the 15-Minute Chart Shows
The 15-minute chart helps traders identify short-term opportunities and momentum shifts.
Key Findings
- Bitcoin recently formed a strong recovery from local lows.
- Buyers have pushed price back above short-term moving averages.
- Momentum has improved in the short term.
- The broader trend remains bearish.
At the moment, the recovery appears corrective rather than a confirmed trend reversal.
Short-term traders may find this guide useful:
Scalping Strategy Using Market Structure (1M–5M Price Action Guide)
https://forexnews360.com/free-guide/market-structure-scalping-strategy/
Possible Trading Scenarios for June
Scenario 1: Bearish Continuation
If Bitcoin fails to break above the 62,500–63,500 resistance zone, sellers may regain control.
A break below 60,000 could expose:
- 58,000
- 56,000
- Potentially lower support areas
What Traders Should Watch
- Rejection candles near resistance
- Lower highs on lower timeframes
- Weak bullish volume
Related reading:
How to Trade Break and Retest Without Getting Faked Out
https://forexnews360.com/free-guide/break-and-retest-strategy-without-fakeouts/
Scenario 2: Short-Term Bullish Recovery
If buyers successfully reclaim 63,500 and hold above it, Bitcoin may attempt a move toward:
- 66,000
- 68,000
- 72,000
However, traders should remember that higher timeframe confirmation remains necessary before calling a new bullish trend.
Risk Management Is More Important Than Predictions
Many traders spend hours trying to predict Bitcoin’s next move.
Professional traders focus on risk management first.
Before entering any trade, consider:
- Position size
- Stop-loss placement
- Risk-to-reward ratio
- Market volatility
- News events
- Trading psychology
Even the best analysis can fail if risk management is ignored.
Related resources:
Forex Risk Management: A Simple Guide to Protecting Your Money
https://forexnews360.com/free-guide/forex-risk-management-guide/
Why Most Beginner Traders Lose Money in Forex Trading
https://forexnews360.com/free-guide/why-beginner-traders-lose-money/
Fundamental Factors Affecting Bitcoin in June
Several factors may influence Bitcoin’s price during June.
1. Federal Reserve Policy
Interest rate expectations continue to influence risk assets, including Bitcoin.
2. Institutional Demand
ETF flows and institutional participation remain important market drivers.
3. US Dollar Strength
A stronger US Dollar often creates pressure on risk assets.
4. Market Sentiment
Fear and uncertainty can accelerate selling pressure.
5. Global Economic Data
Inflation reports, employment data, and central bank decisions may increase volatility.
Educational Note for Traders
Technical analysis provides probabilities rather than certainty.
Charts help traders identify:
- Market trends
- Support zones
- Resistance levels
- Momentum changes
- Potential trading opportunities
However, no strategy can predict future prices with complete accuracy.
Successful traders focus on:
- Discipline
- Consistency
- Patience
- Risk control
- Continuous learning
For beginners:
Forex Trading for Beginners: Complete Guide to Pips, Leverage, Risk Management, and Trading Psychology
https://forexnews360.com/free-guide/forex-trading-for-beginners-guide/
Candlestick Patterns – How to Read Candlestick Charts for Beginners
https://forexnews360.com/free-guide/candlestick-patterns/
Analyst’s View
Based on the current 4-hour and 15-minute chart structure, Bitcoin remains under pressure despite the recent bounce from support.
The recovery is encouraging for buyers, but the market still needs to reclaim the 62,500–63,500 resistance zone before a larger bullish recovery becomes likely.
As long as Bitcoin remains below major resistance levels, traders should continue monitoring for signs of bearish continuation.
The 60,000 level remains the most important support zone to watch throughout June.
Related Bitcoin & Trading Guides
- How to Trade Bitcoin for Beginners: A Simple 2026 Guide
https://forexnews360.com/free-guide/bitcoin-trading-for-beginners-guide/ - Market Bias in Forex: Institutional Smart Money Guide to Directional Trading
https://forexnews360.com/free-guide/market-bias-in-trading/ - Forex Risk Management: A Simple Guide to Protecting Your Money
https://forexnews360.com/free-guide/forex-risk-management-guide/ - Moving Averages (EMA vs SMA): Complete Beginner Guide
https://forexnews360.com/free-guide/moving-averages-ema-vs-sma/ - What Is Support and Resistance? Beginner Trading Guide
https://forexnews360.com/free-guide/support-and-resistance-in-trading/
Conclusion
Bitcoin begins June 2026 at a critical point. The recent recovery from the 60,000 support area has improved short-term sentiment, but the higher timeframe trend remains bearish.
Key support levels at 60,000 and 58,000 will be important throughout the month, while resistance around 63,500 and 68,000 may determine whether buyers can regain momentum.
Traders should remain patient, follow risk management principles, and avoid making trading decisions based solely on a single opinion or chart setup.
Disclaimer: Trading forex and CFDs involves significant risk and may not be suitable for all investors. This article is for educational purposes only and should not be considered financial advice.
About the Author : Written by Shah – Forex trader and market analyst at Forex News 360.